Why Most Support Lines Fail (And How to Spot the Ones That Hold)


📊 July 25, 2026
- Support is an order-flow liquidity zone, not a razor-thin price line drawn across a chart.
- The single biggest flaw in retail trading is buying every single retest of a level regardless of seller velocity or volume.
- Focus on high-volume rejection wicks and declining seller volume inside shaded demand zones when markets open Monday.
— Ben, Find Better Trades
Most retail traders treat chart support like a trampoline. They draw a thin line across a few low points, wait for price to touch it, and instantly smash the buy button expecting a quick rebound.
That exact habit is why so many retail accounts get liquidated on obvious breakdown traps. If you want to protect your capital and find high-probability setups, you need to stop viewing support as a magic boundary and start treating it as dynamic order flow.
Why Everyone Gets This Wrong
Conventional trading books tell you that the more times a support level gets tested, the stronger it becomes. That idea is dead wrong, and believing it will bleed your trading account dry.
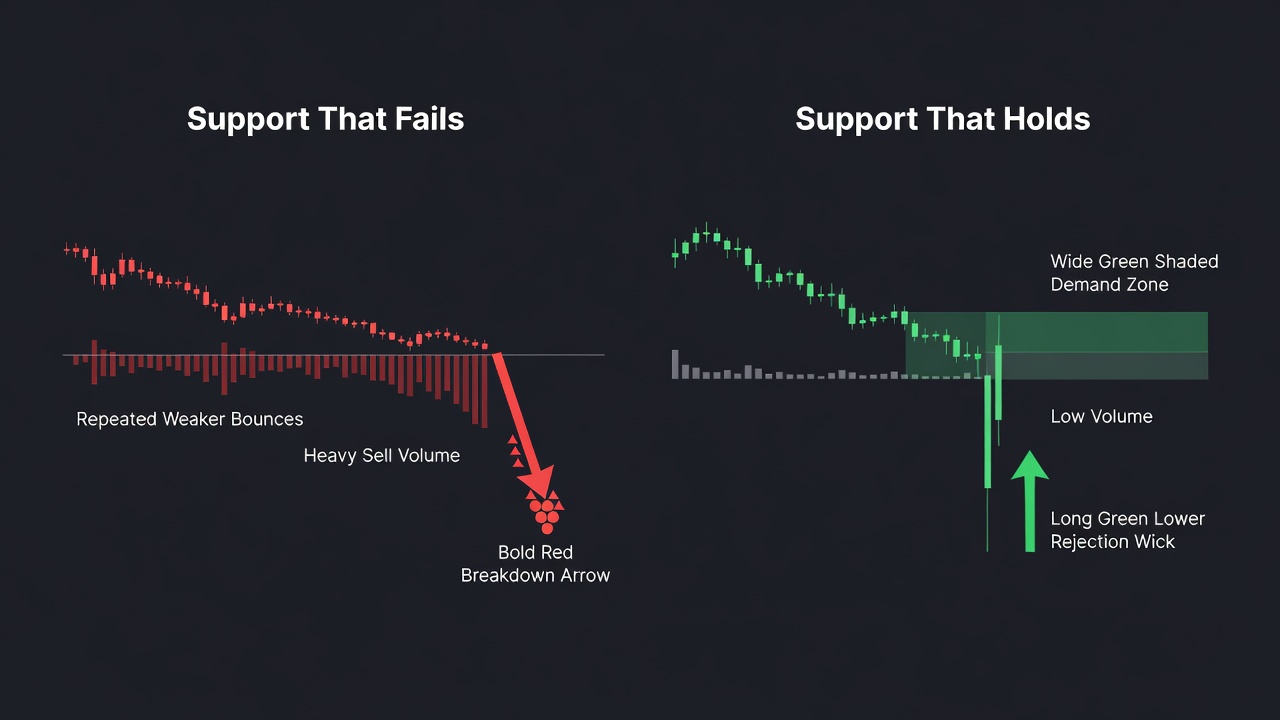
Every single time price hits a support level, resting buy orders get filled and removed from the market depth. Think of buyer liquidity like wood thrown onto a fire; each retest consumes more of that fuel until there is nothing left to absorb seller pressure.
When a stock approaches a key level for the fourth or fifth time, that is not confirmation of strength. It is proof that aggressive sellers are relentlessly pushing price down and absorbing every bid sitting at that price point.
Retail traders keep buying these exhausted retests because their textbook told them to. Then, an aggressive institutional sell order slices straight through the level, triggering a flood of retail stop-loss orders that fuels a violent breakdown down to the next liquidity pool.
The fundamental flaw in the standard approach is treating support as a static line rather than an active battleground. When you blindly buy a line without assessing order flow, you are gambling against large market participants who are actively driving price into liquidity.
What Actually Works
If you want to trade support levels that actually hold, you must change how you identify and validate demand. First, stop drawing razor-thin horizontal lines and start drawing shaded demand zones that account for market noise and spread.
Institutional buyers do not place millions of dollars in orders at one precise cent; they build positions across a price range. A proper zone gives price room to breathe without prematurely knocking you out on a minor spike.
Second, analyze the velocity and volume of the price approach heading into that zone. When price aggressively crashes into a support level on surging volume, support almost always breaks like thin glass.
What you want to see instead is price drifting slowly into the support zone on declining selling volume. That drop in volume tells you that seller momentum is drying up and supply is becoming exhausted before price even touches the zone.
Third, demand proof that buyers are home before putting your money on the line when Monday’s open arrives. Never guess that support will hold before seeing a price action response.
Look for a prominent lower rejection wick on heavy volume inside the demand zone. That wick proves that institutional buyers actively absorbed supply, defended the area, and aggressively pushed price back up off the lows.
Heading into next week, your framework is straightforward: locate the demand zone, verify shrinking seller volume as price approaches, and wait for a clear rejection candle before entering long.
When Support Lines Can Still Help
A simple horizontal support line is not entirely useless, provided you understand its narrow purpose. It serves as a visual bookmark on higher-timeframe charts to mark areas where price previously changed direction.
It is also useful for identifying where retail stop-loss liquidity is concentrated. Knowing where retail traders placed their stops allows you to anticipate institutional liquidity sweeps before taking a position in the true direction.
🎯 Want Setups Like These? The Big Dipper Does the Scanning For You.
Every morning the Big Dipper delivers curated DIP ZONE trade ideas — stocks already at high-probability entry levels, with targets pre-set. No guessing, no scanning. Just setups.


Support Level FAQs for Traders
Q: How many times can a support level be retested before it is likely to break?
A: The first and second retests offer the highest probability bounces because buyer liquidity is fresh. By the third or fourth touch, bids are usually exhausted and a breakdown becomes much more likely.
Q: Should I place a limit order directly at the support level?
A: No, placing blind limit orders at static lines invites heavy slippage during breakdown moves. Wait for price to enter the demand zone and show a clear rejection wick on Monday’s open before executing your trade.
Free For Traders
Know The EXACT Moment A Stock Hits Support Or Resistance
Real-time alerts fire the instant a stock approaches a critical level. Completely free.

From Find Better Trades
Catch The Reversal Before It Wrecks Your Gains
Pattern-recognition scanner that spots bearish reversals early — protect your profits or time short entries with confidence.

📈 Want More? Join Our Free Trading Community
- Trading Strategy Guides Telegram — daily strategy tips and market insights
- Find Better Trades Telegram — free trade signals delivered to your phone
- Find Better Trades on YouTube — live trade breakdowns and tutorials