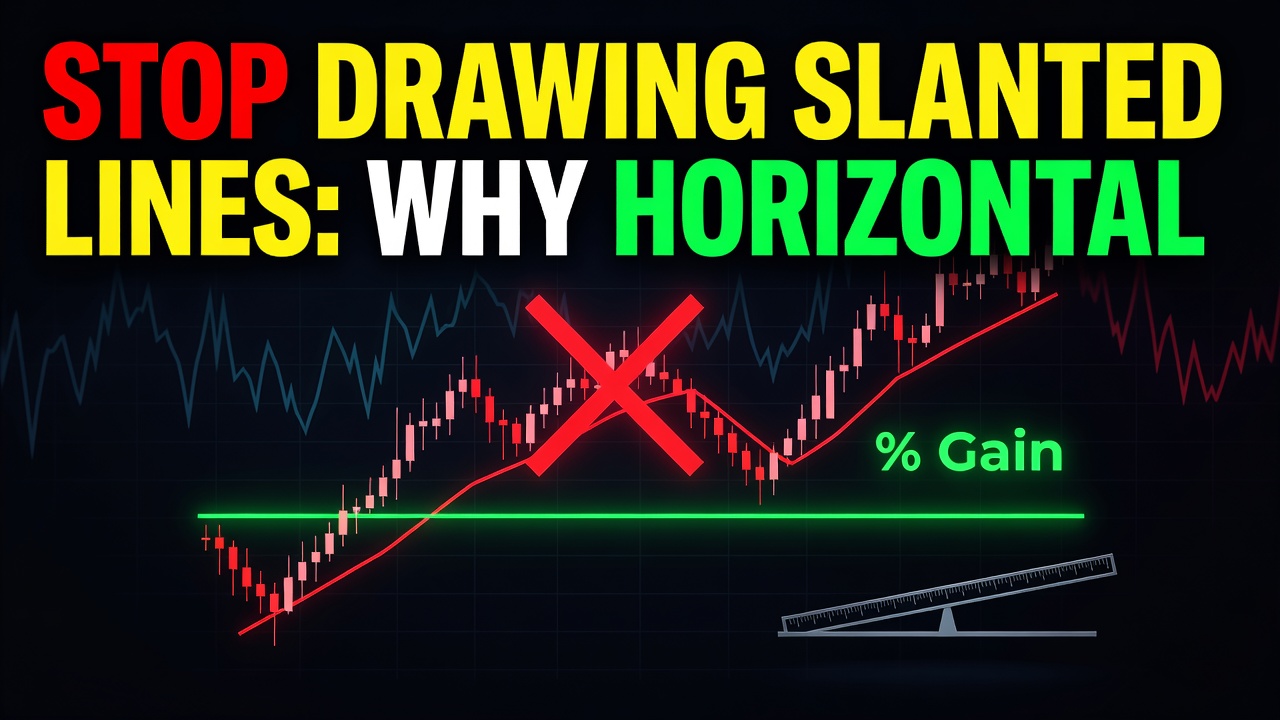
Stop Drawing Slanted Lines: Why Horizontal Levels Beat Trendlines Every Time

📊 July 20, 2026
- Horizontal support and resistance is the only objective way to map market structure.
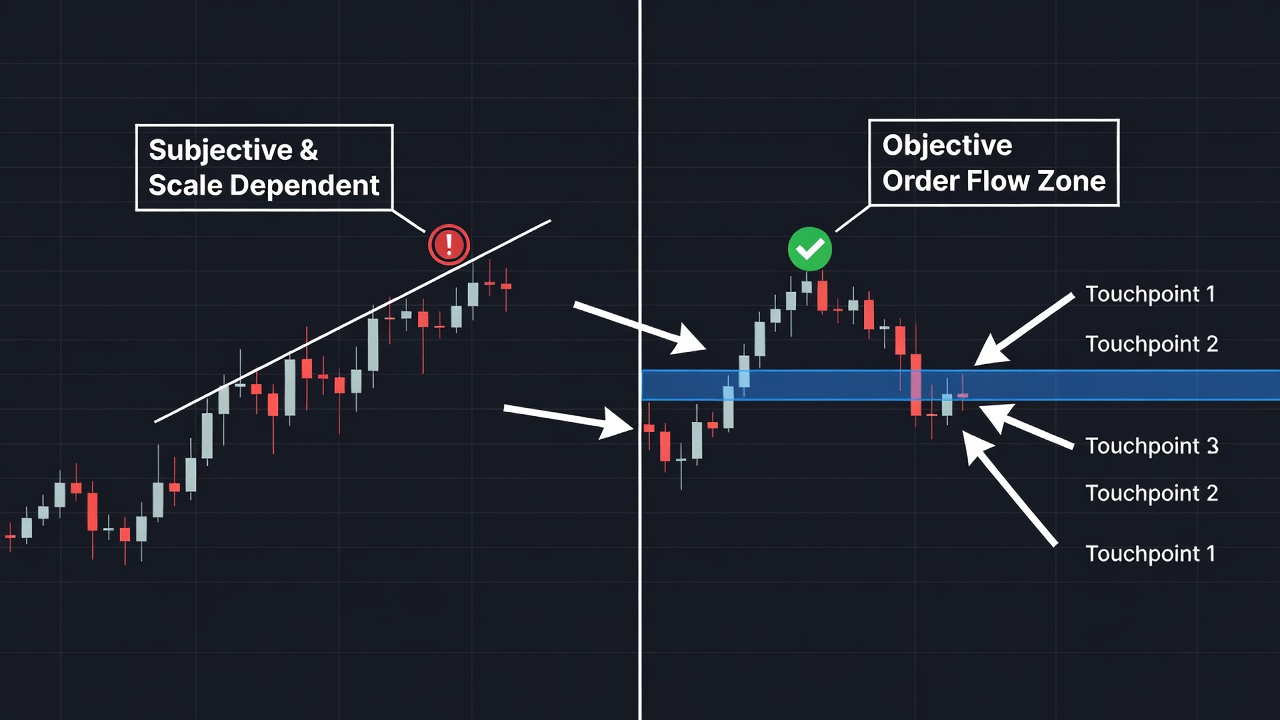
- Trendlines are highly subjective, mathematically unstable, and easily manipulated by changing your chart scale.
- Ditch the diagonal lines and focus exclusively on major historical price pivots where actual order flow rests.
— Ben, Find Better Trades
Every rookie trader starts their journey by opening a chart and drawing a diagonal line connecting three random price peaks. They treat this trendline like a sacred wall of steel, only to watch price slice through it like hot butter five minutes later. The truth is simple: trendlines are a subjective illusion that will bleed your trading account dry.
Why Everyone Gets This Wrong
The core problem with diagonal trendlines is that they are entirely subjective. If you ask five different traders to draw a trendline on the daily chart, you will get five completely different lines. Some will connect the candle wicks, others will connect the candle bodies, and some will just ignore the outliers entirely to make the line fit their bias.
This subjectivity makes them useless for real trading. Even worse, trendlines are highly sensitive to chart scaling. If you switch your chart from log scale to arithmetic scale, your trendline shifts completely, changing your breakout point by dozens of pips or points. How can a level be valid if it moves just because you changed your screen settings?
Think about a classic scenario where price is making higher highs and higher lows, and you draw a perfect diagonal support line. On the next pullback, price breaks the line, triggers your stop loss, and then immediately reverses to head straight to your original target. You did not get run over by institutional algorithms; you got trapped by a mathematically unstable line that the market did not care about in the first place.
What Actually Works
If you want to trade with the big money, you must look at the market the way institutional order books see it. Market orders, buy stops, and sell stops do not sit along a moving, diagonal plane. Limit orders and stop pools sit at static, horizontal price points where heavy trading volume actually occurred in the past.
Horizontal levels are objective and do not change based on your chart settings or the time frame you are viewing. A major daily swing high from last month is at the exact same price level whether you look at it on a 5-minute chart, a 4-hour chart, or a monthly chart. This consistency is why horizontal levels create real, repeatable reactions.
To trade this effectively, stop looking for exact, pixel-perfect price touches. Start drawing your horizontal levels as thin zones where price has previously experienced a sharp reversal. When price returns to these historical zones, you wait for evidence of buying or selling pressure before entering, rather than blindly guessing where a diagonal line might hold.
When Trendlines Can Still Help
I am not saying you should delete your trendline tool entirely, but you must drastically downgrade its importance. Trendlines should only be used as a quick visual aid to identify the overall direction of the market at a glance. If the slope is up, the trend is up; if the slope is down, the trend is down.
Never use a diagonal line to trigger an entry, set a stop loss, or determine a profit target. Use them exclusively to gauge market momentum, and let horizontal levels do the heavy lifting when it is time to risk real capital.
🎯 Want Setups Like These? The Big Dipper Does the Scanning For You.
Every morning the Big Dipper delivers curated DIP ZONE trade ideas — stocks already at high-probability entry levels, with targets pre-set. No guessing, no scanning. Just setups.


Frequently Asked Questions About Support and Resistance
Q: Should I draw horizontal levels from the candle wicks or the candle bodies?
A: You should focus on zones that encompass both, treating the space between the candle body close and the wick extreme as a zone of interest rather than a single line.
Q: How far back should I look on my charts to find valid horizontal levels?
A: Focus primarily on the most recent major swing highs and lows on the daily and 4-hour timeframes, as fresh levels carry significantly more order flow than levels from years ago.
🎯 Get High-Probability Trade Setups — Free
The Big Dipper Dashboard delivers curated trade ideas straight to your screen every morning. Know what to watch before the opening bell.

📈 Want More? Join Our Free Trading Community
- Trading Strategy Guides Telegram — daily strategy tips and market insights
- Find Better Trades Telegram — free trade signals delivered to your phone
- Find Better Trades on YouTube — live trade breakdowns and tutorials