Stop Drawing Single Lines: The Real Way to Find Support and Resistance

📊 July 19, 2026
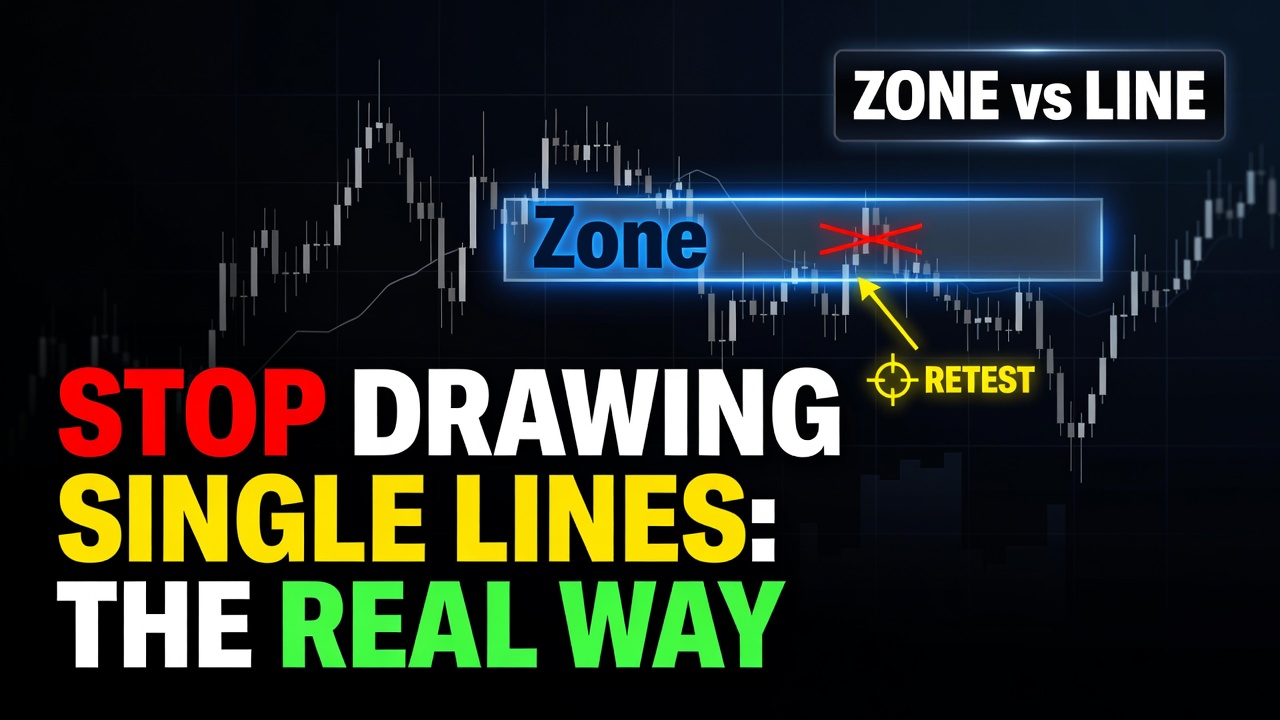
- Support and resistance are thick zones of order flow, not single-pixel lines on your screen.
- The single biggest flaw is treating a precise price point as a barrier, leading to constant premature stops.
- Identify where high-volume order blocks and previous consolidations overlap to draw high-probability zones instead.
— Ben, Find Better Trades
Retail traders love drawing thin, exact lines on their charts and pretending the market respects them down to the penny. It does not. If you are still trying to trade exact price levels, you are giving liquidity directly to the institutions who hunt your stops heading into Monday’s open.
The market is a auction run by order flow, not a geometry class. To survive, you must stop looking for exact inflection points and start mapping out zones of supply and demand.
Why Everyone Gets This Wrong
Most traders open a chart, find three random wick highs, and connect them with a razor-thin line. They think they have found a resistance level. Then, when markets open tomorrow, price spikes three pips above that line, triggers their short entry, runs their stop, and immediately reverses back down.
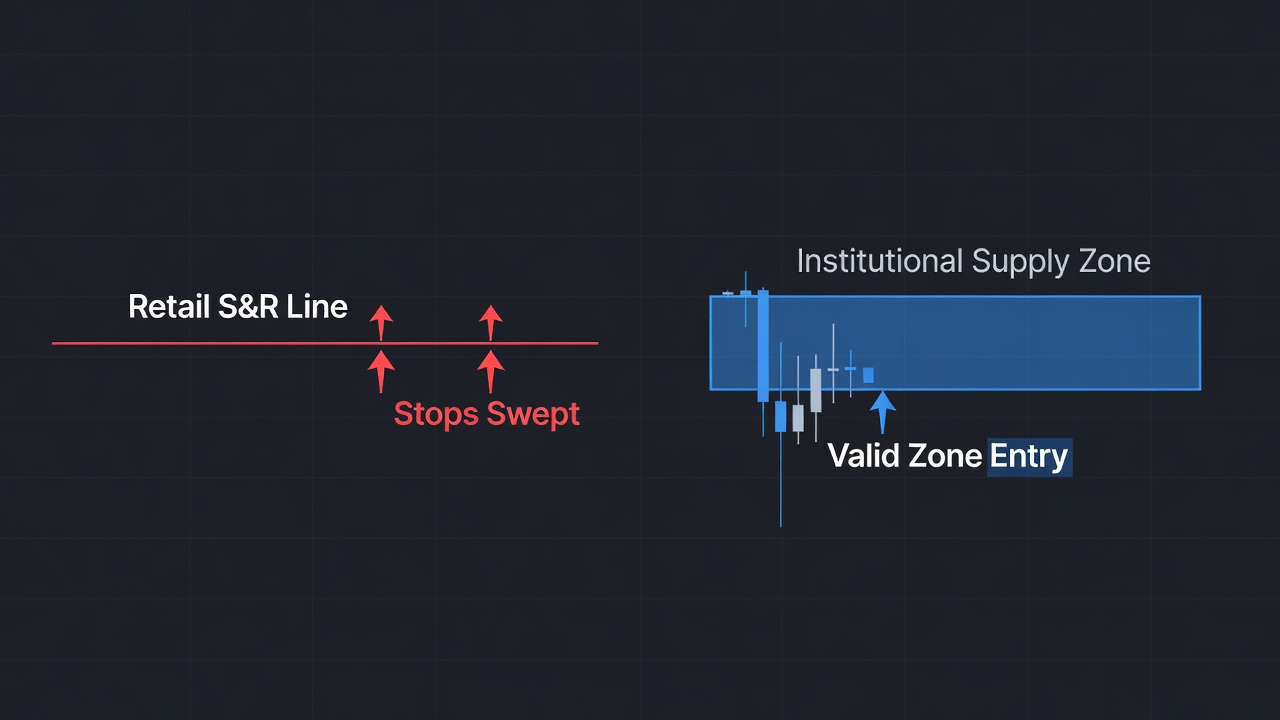
This happens because institutions do not transact at a single price point. Large funds have millions of shares or contracts to execute, meaning they must accumulate or distribute positions across a range of prices. When you draw a single line, you ignore the entire auction process.
Think of a typical scenario where price approaches a previous swing high of 150.00. Retail traders place their sell orders exactly at 150.00 with stops at 150.15. Smart money sweeps those stops up to 150.30 to fill their own massive short orders before pushing the market down, leaving the retail traders stopped out and frustrated.
What Actually Works
To find levels that actually hold, you must identify high-volume order blocks and previous consolidation zones. Instead of drawing a line at a specific wick, look for the entire congestion area where price spent hours exchanging hands before a major breakout.
Draw a shaded rectangle spanning from the body of the candles in that consolidation to the extremes of the wicks. This creates a high-probability zone of support or resistance. When price approaches this zone, you do not blindly place a limit order; you wait for price action to show exhaustion within the box.
By treating these levels as zones, you give your trades room to breathe. When you look at your charts ahead of Monday, adjust your risk parameters to account for volatility inside these shaded areas rather than choking your trade with a tight, arbitrary stop-loss.
When Single Lines Can Still Help
There is only one scenario where a single line makes sense: mapping out the absolute yearly highs or lows. These extreme levels represent psychological breaking points where market structure completely shifts on a macro scale.
Even then, do not trade them with tight stops. Use those single lines purely as directional bias indicators to tell you whether the overall market is in a long-term bull or bear regime.
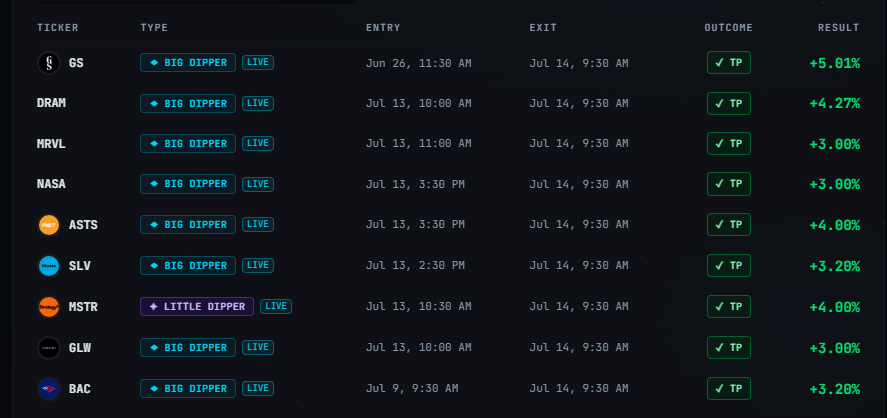
🎯 Want Setups Like These? The Big Dipper Does the Scanning For You.
Every morning the Big Dipper delivers curated DIP ZONE trade ideas — stocks already at high-probability entry levels, with targets pre-set. No guessing, no scanning. Just setups.

Frequently Asked Questions About Support and Resistance
Q: How wide should my support and resistance zones be?
A: Your zones should span from the closing bodies of the candles in a consolidation area to the absolute lowest or highest wick extremes of that same structure.
Q: Should I draw zones on the 5-minute chart or the daily chart?
A: Always start on the daily and 4-hour charts to find the major zones of institutional order flow, then use lower timeframes only to refine your entries within those major zones.
🎯 Get High-Probability Trade Setups — Free
The Big Dipper Dashboard delivers curated trade ideas straight to your screen every morning. Know what to watch before the opening bell.

📈 Want More? Join Our Free Trading Community
- Trading Strategy Guides Telegram — daily strategy tips and market insights
- Find Better Trades Telegram — free trade signals delivered to your phone
- Find Better Trades on YouTube — live trade breakdowns and tutorials