Why I Am Aggressively Adding to My SLV Long Position Right Here

📊 July 17, 2026
- SLV is sitting directly on a massive historical support floor at $50, offering an asymmetric long entry.
- A confirmed daily bounce off the $50 level targets a recovery back into Zone 1 near $58.
- A daily close below the major historical breakout level at $48.70 invalidates the bullish thesis entirely.
— Ben, Find Better Trades
Silver has spent the last few weeks punishing late buyers, but the relentless selling has finally pushed us right into a high-probability reversal zone. I am not sitting on my hands for this one. I continue to be highly active in adding to my SLV long position here using both common shares and the October 16th $50 CALL options.
What the Chart Is Telling Me
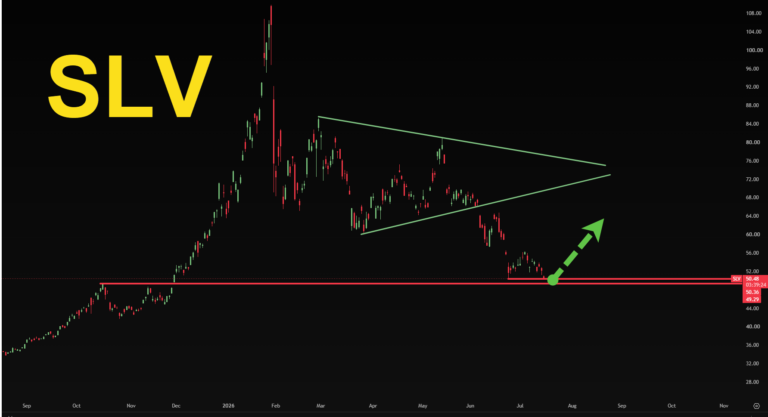
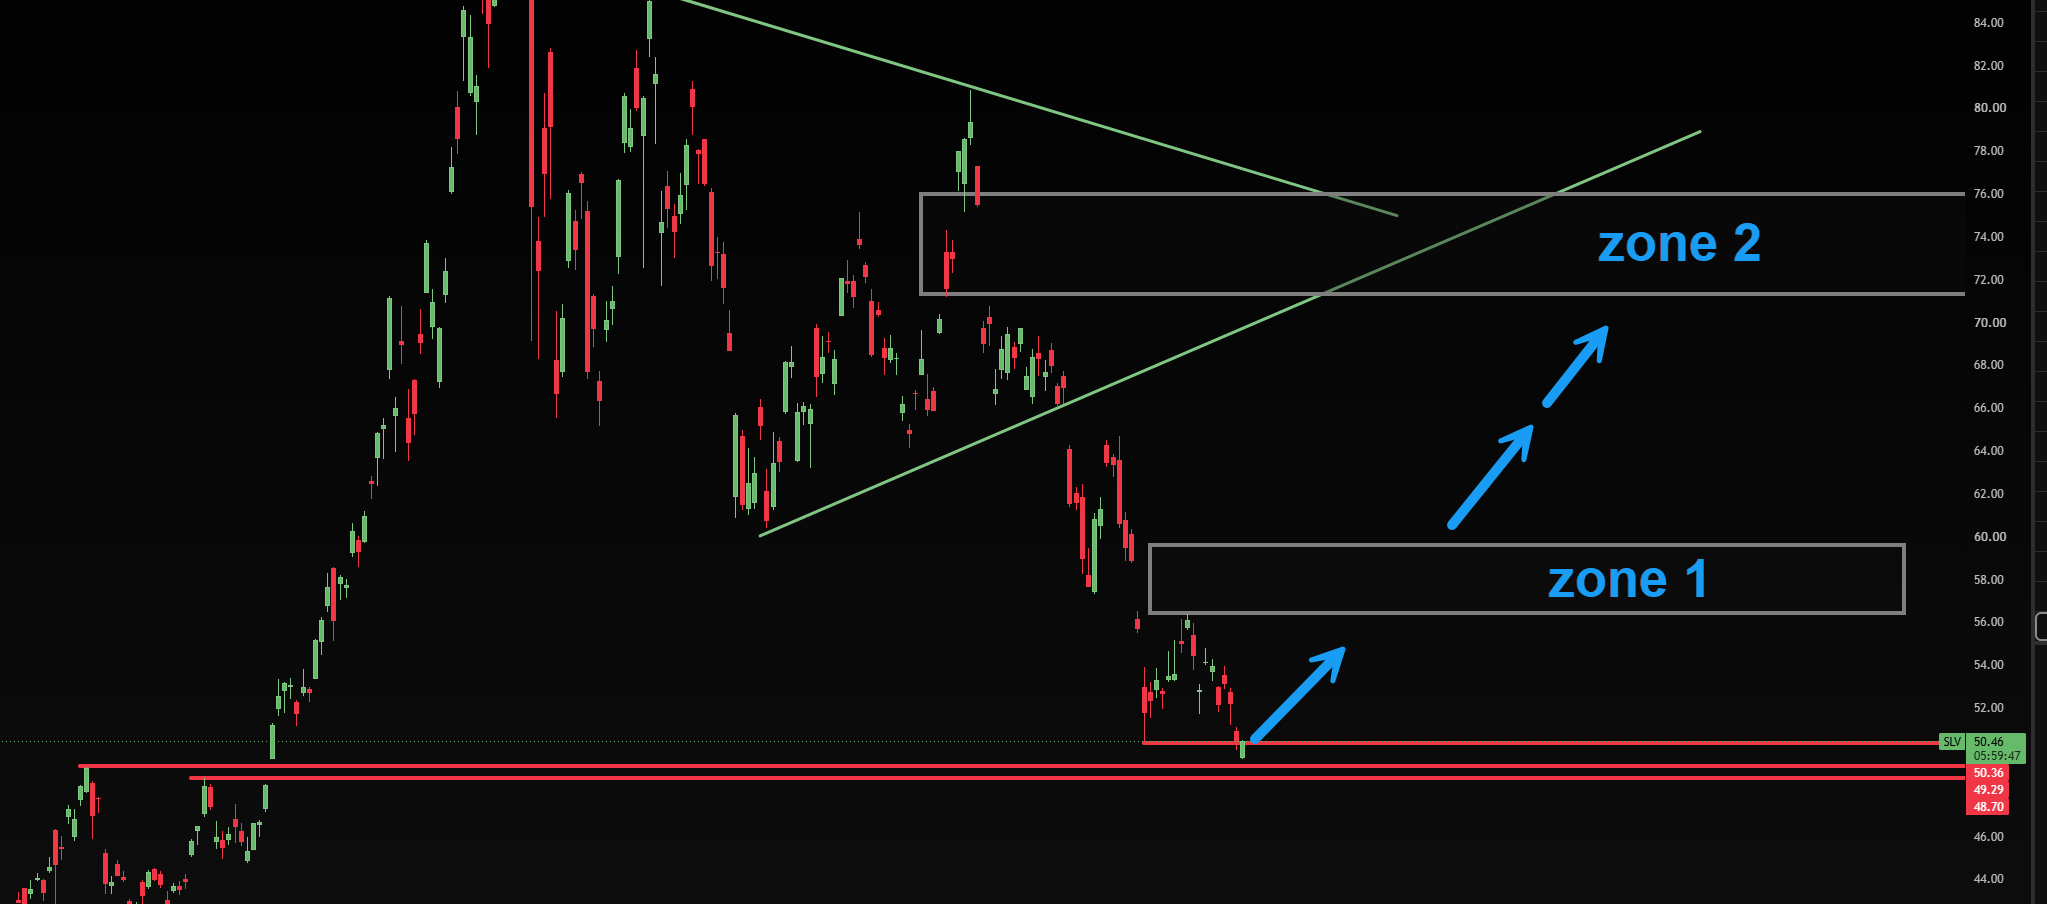
The technical structure on SLV is showing a classic retest of previous major resistance turned support. If you look back at the left side of the chart, the region between $48.70 and $50.36 acted as a fierce ceiling that capped rallies for months. Now that we have broken out and pulled all the way back, this zone is serving as our primary defensive floor.
We have a clean descending structure that has flushed out weak hands, bringing the price directly down to the green SLV horizontal support at $50.46. The red lines below it at $50.36, $49.29, and $48.70 represent a deep pocket of historical buying liquidity. This is exactly where institutional buyers step in to defend their original breakout positions.
I see two distinct target zones on this bounce play. First, we have Zone 1 sitting between $56.00 and $59.00, which served as a prior consolidation shelf before the recent flush. Above that, Zone 2 rests between $71.00 and $76.00, aligning with the major multi-month trendline intersection. The path of least resistance from this $50 floor is a sharp snapback to test these broken structures.
The Trade / What I’m Watching
My execution strategy is simple and highly aggressive because the risk-to-reward ratio is heavily skewed in our favor. I am accumulating spot SLV shares and locking in leverage via the October 16th $50 strike CALL options to capture the bulk of this move. Buying October expiration gives us plenty of time for the thesis to mature without getting chopped up by short-term volatility.
The trigger for the first phase of this recovery is a clean daily candle close green off this $50.46 level. Once we establish that local bottom, the immediate target is Zone 1. If we can reclaim Zone 1 and turn it back into support, the momentum should easily carry us up toward the massive trendline confluence in Zone 2.
Invalidation is crystal clear. I am not interested in holding a dead weight position if this support floor crumbles. A daily candle close below the absolute bottom of our red support cluster at $48.70 proves the buyers have completely lost control, and I will cut the trade immediately to preserve capital.
Risk & What Could Go Wrong
The main risk here is a broader market liquidation event that drags precious metals down regardless of technical support. If the macro environment deteriorates rapidly, sellers might slice straight through the $50 level without giving us a clean bounce opportunity.
Additionally, because I am using October options, prolonged consolidation sideways at the $50 level will hurt us through theta decay. We need to see buyers step up and defend this level with relative speed to keep the momentum alive.
SLV Support and Trade Structure FAQ
Q: Why use October 16th options instead of shorter-dated contracts?
A: Choosing October options provides roughly three months of duration, giving the trade room to absorb short-term fakeouts and consolidate at support without theta decay rapidly destroying the option value.
Q: What makes the $50 level more significant than previous support levels?
A: The $50 area represents a psychological milestone and a major historical breakout point where massive overhead resistance was broken, which structurally makes it the strongest demand zone on the entire chart.
🎯 Get High-Probability Trade Setups — Free
The Big Dipper Dashboard delivers curated trade ideas straight to your screen every morning. Know what to watch before the opening bell.

📈 Want More? Join Our Free Trading Community
- Trading Strategy Guides Telegram — daily strategy tips and market insights
- Find Better Trades Telegram — free trade signals delivered to your phone
- Find Better Trades on YouTube — live trade breakdowns and tutorials