
Stop Chasing Lines: How I Actually Trade Key Price Levels

📊 July 16, 2026
- Key price levels are zones of high-volume transactions, not exact pixel-perfect single lines on your chart.
- The single biggest flaw is treating a single dollar figure as a hard wall, leading to constant premature stop-outs and missed entries.
- What to do instead is map out dynamic horizontal zones and wait for price action confirmation within those bands.
— Ben, Find Better Trades
Retail traders love drawing dozens of thin, precise lines on their charts and treating them like brick walls. They expect the market to reverse exactly at $150.00, only to get stopped out when price spikes to $148.50 before soaring. I do not trade lines; I trade structural zones where institutional orders actually rest.
Why Everyone Gets This Wrong
The conventional wisdom taught in basic trading books tells you to find a swing high, draw a razor-thin horizontal line, and buy the exact moment price touches it again. This ignores the basic mechanics of order flow and market liquidity. Large players cannot fill their massive positions at a single exact price without causing massive slippage.
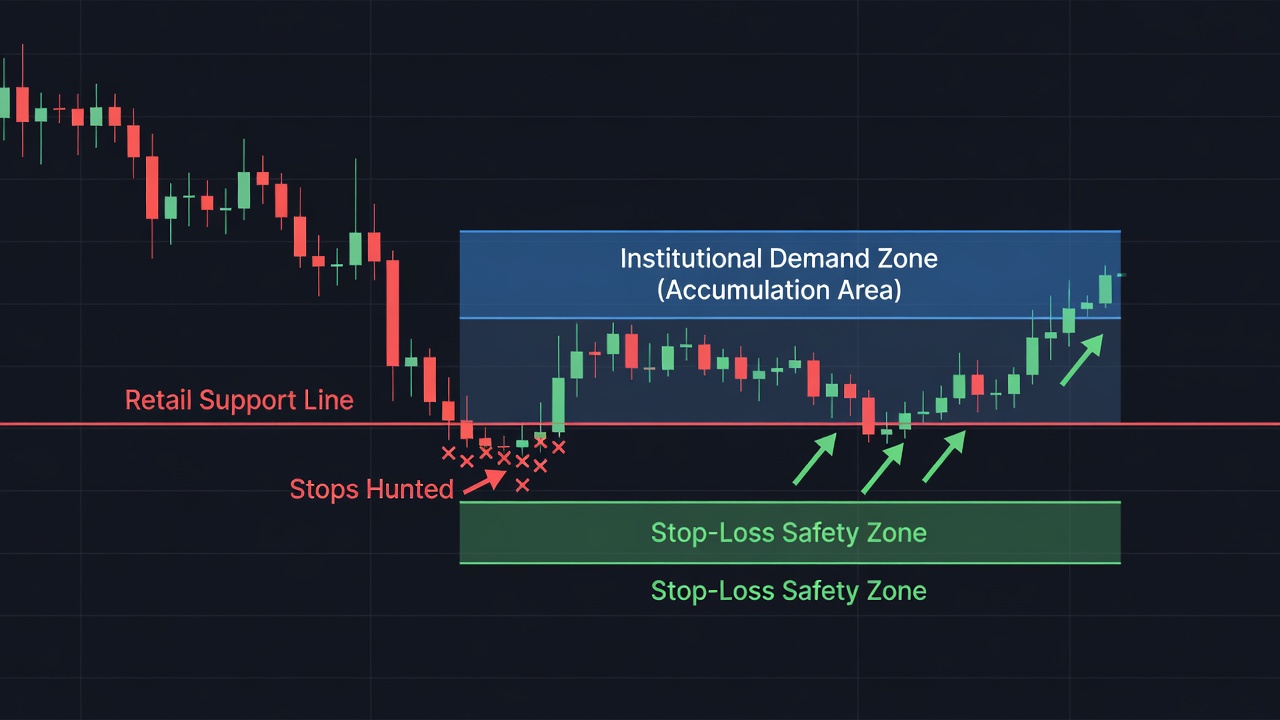
Think about a scenario where a stock rallies to $200, pulls back, and approaches that level again. Retail traders set their buy limit orders exactly at $200.00 and their stop-losses at $199.00. Market makers know this liquidity rests just below the round number, so they push the price down to sweep those stops at $198.50, collect the shares, and reverse the trend upward.
By treating support and resistance as rigid lines, you are essentially handing your money to institutions who hunt those obvious stop-loss clusters. Price is fluid, and key levels are always a battleground, not a hard shelf. If you do not allow for breathing room within a defined range, you will get shaken out of winning trades repeatedly.
What Actually Works
To fix this, you must start drawing support and resistance as shaded coordinate zones rather than single lines. I look back at the historical candle bodies and wicks in a consolidated area to define a high-probability demand or supply band. This band represents the entire footprint where heavy buying or selling occurred, giving me a realistic field of play.
Once price enters this designated zone, I do not blindly enter a trade with a limit order. I wait for price action confirmation on a lower timeframe, looking for a shift in market structure like a bullish engulfing candle or a failure to close below the zone. This confirmation tells me that buyers are actively stepping in to defend the level before I risk a single dollar.
Your stop-loss should never be placed inside the zone or just a few cents below a swing low. Instead, place your risk invalidation point entirely outside the outer boundary of the shaded area. This simple structural shift keeps you in the trade during normal intraday volatility while protecting your capital if the level truly fails.
When Rigid Levels Can Still Help
There is one specific scenario where a precise, single price point carries genuine weight: the daily open and yesterday’s close. These specific prices act as psychological benchmarks for institutional algorithms and intraday trend bias. While they still experience some noise, they offer a clear line in the sand for daily momentum.
Beyond those daily reference points, you must stick to structural zones if you want to survive. Embracing price zones will immediately stop you from buying the absolute top of a fakeout breakout or selling the exact bottom of a liquidity sweep.
🎯 Want Setups Like These? The Big Dipper Does the Scanning For You.
Every morning the Big Dipper delivers curated DIP ZONE trade ideas — stocks already at high-probability entry levels, with targets pre-set. No guessing, no scanning. Just setups.


Frequently Asked Questions About Price Levels
Q: How wide should my support and resistance zones be?
A: Your zones should span from the bodies of the candles that formed the swing high or low to the outer tips of their wicks. This captures the entire area of market indecision and order execution.
Q: Do key price levels work better on higher timeframes?
A: Absolutely, because levels drawn on the daily or weekly charts represent massive institutional capital commitments. Intraday levels on a five-minute chart are highly noisy and easily broken by minor order flow.
🎯 Get High-Probability Trade Setups — Free
The Big Dipper Dashboard delivers curated trade ideas straight to your screen every morning. Know what to watch before the opening bell.

📈 Want More? Join Our Free Trading Community
- Trading Strategy Guides Telegram — daily strategy tips and market insights
- Find Better Trades Telegram — free trade signals delivered to your phone
- Find Better Trades on YouTube — live trade breakdowns and tutorials


