
The Real Reason Your Breakout Trades Fail (And How to Spot It)


📊 July 14, 2026
- Breakouts fail because retail traders buy the initial lag of late-stage momentum instead of reading the order flow distribution.
- The single biggest flaw is blindly placing buy-stops above obvious resistance levels without checking how price behaved on the approach.
- Look for tight, high-volume consolidation right under the level—the build-up—rather than chasing vertical, exhausted candles.
— Ben, Find Better Trades
Most traders treat resistance like a glass ceiling that shattered, assuming once price clears it, the sky is the limit. In reality, that obvious line on your chart is a liquidity trap designed to suck you into a bad position just before the big players dump their inventory. If you are tired of buying the absolute top of a breakout only to watch it instantly reverse, you need to stop blaming bad luck.
Why Everyone Gets This Wrong
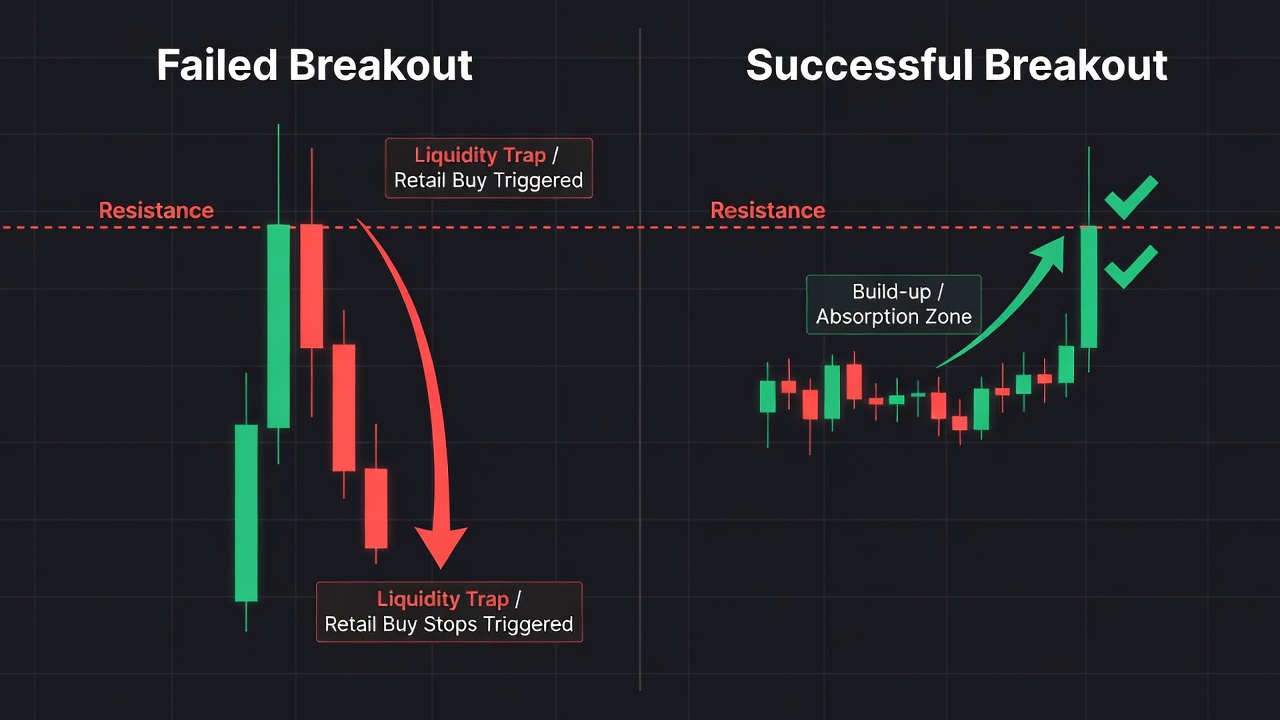
Retail breakout strategies fail because they rely on lag. The traditional playbook says to place a buy-stop order just above a major resistance level, expecting a surge of buying volume to carry your trade into profit. What actually happens is that smart money uses that exact surge of retail buy orders to exit their own long positions.
Think about the mechanics of the market for a second. To sell a massive position without crashing the price, a large fund needs a massive pool of buyers. Your breakout buy-stop, along with thousands of others, provides that exact liquidity. The moment those buy-stops are triggered, the buying pressure dries up, and the market plummets because there are no actual buyers left to support the higher price.
You can see this clearly when a stock surges vertically toward resistance on a massive, isolated green candle. It looks strong on your chart, but it is actually an exhausted move. Without a solid base of accumulation right beneath the breakout level, the price has no foundation to stand on once the initial momentum fades.
What Actually Works
To trade breakouts successfully, you have to shift your focus from the breakout candle itself to the price action that precedes it. I want to see what I call a build-up, which is a tight, low-volatility consolidation resting right against the resistance level. This tells me that sellers are active, but buyers are absorbing every single share they throw at the market.
When price refuses to pull back from resistance and instead grinds sideways in a narrow range, it means supply is being dried up. The buyers are holding their ground, refusing to let the price drop because they expect it to go much higher. This creates a spring-like effect where very little effort is required to push the price through the ceiling.
By entering your trade inside this tight consolidation, rather than waiting for the actual breakout candle, you get two massive advantages. Your risk is incredibly small because you can place your stop-loss just below the tight consolidation. More importantly, you are positioned before the herd, meaning you can sell your position to the retail traders chasing the breakout.
When the Traditional Breakout Can Still Help
This does not mean you should delete horizontal resistance lines from your charts completely. Obvious levels are highly useful, but only as a map of where emotional traders are likely to make mistakes. You want to use these levels to gauge market character rather than blindly executing orders around them.
If a breakout occurs on a massive surge in volume and holds above the level for several hours without an immediate retracement, it suggests genuine institutional buying. However, instead of chasing that initial thrust, the professional move is to wait for a successful test of that level from above, turning old resistance into new support.
Frequently Asked Questions About Breakouts
Q: Why do breakouts fail so often in choppy or sideways markets?
A: Breakouts require strong market-wide trend participation to sustain themselves, whereas sideways markets are dominated by mean-reversion algorithms that actively target external liquidity pools above resistance and below support.
Q: How do I know if a consolidation under resistance is accumulation or distribution?
A: Look at the depth of the pullbacks within the range; if the pullbacks are getting progressively shallower, forming higher lows right up against the resistance line, it is accumulation.
🎯 Get High-Probability Trade Setups — Free
The Big Dipper Dashboard delivers curated trade ideas straight to your screen every morning. Know what to watch before the opening bell.

📈 Want More? Join Our Free Trading Community
- Trading Strategy Guides Telegram — daily strategy tips and market insights
- Find Better Trades Telegram — free trade signals delivered to your phone
- Find Better Trades on YouTube — live trade breakdowns and tutorials


