
Your Five-Indicator Chart Is Why You Keep Losing Money

📊 September 29, 2026
- Stacking three or four momentum oscillators is not confluence; it is redundant lag that guarantees you enter trades too late.
- Traders confuse multicollinearity with real confirmation, forgetting that almost every common indicator simply repackages the exact same closing price.
- Strip your charts down to market structure, pick one single context tool, and trigger your entries purely off price action.
— Ben, Find Better Trades
If your trading screen looks like a neon spaghetti bowl of Bollinger Bands, MACD ribbons, and dual stochastics, you are trading fear instead of price. You think adding another oscillator gives you a safer confirmation before pulling the trigger. It doesn’t.
All it really does is guarantee you hesitate until the edge is completely gone, leaving you holding the bag when smart money exits. The hardest truth in retail trading is that more indicators never equal more certainty.
Why Everyone Gets This Wrong
The average trader loads up a chart with RSI, MACD, and Stochastics, believing three separate green signals make a trade bulletproof. In reality, you are committing the cardinal sin of technical analysis: multicollinearity. Those three indicators all derive their values from the exact same mathematical inputs—recent closing prices over arbitrary lookback windows.
You do not have three independent confirmations backing your trade idea. You have one single observation repeated back to you through three slightly different smoothing formulas, each adding an extra layer of delay. By treating redundant math as real confluence, you trick yourself into a false sense of security that costs real money.
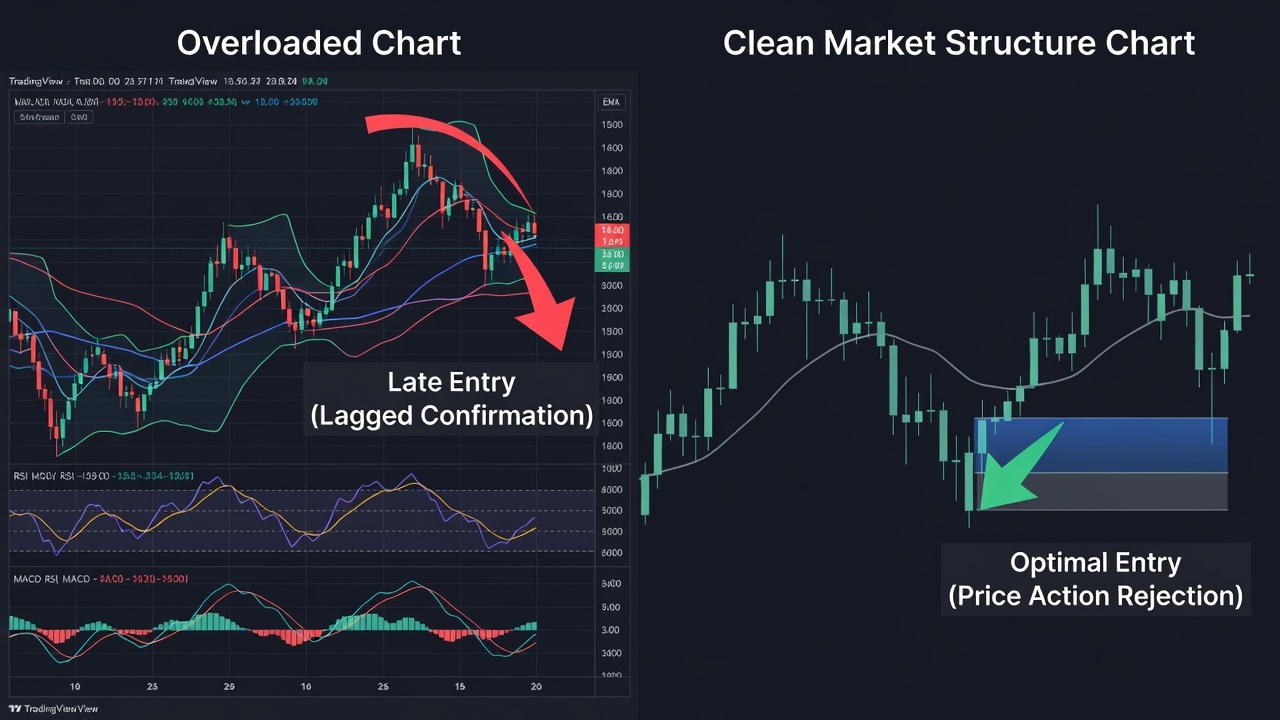
Picture a clean breakout setup where price compresses tightly under key resistance before ripping higher on sudden aggressive volume. A price action trader buys the immediate retest of the broken level, securing a tight stop and an asymmetric risk-reward ratio. Meanwhile, the indicator-heavy trader sits frozen waiting for confirmation.
You wait for your 20 EMA to curl upward, your MACD line to cross its signal, and your RSI to clear the 50 line. By the time all three formulas finally register the move and flash green, price has already traveled three full ranges into major overhead supply. You buy at the exact moment the initial impulse exhausts itself, leaving your stop impossibly wide right before a normal pullback wipes you out.
What Actually Works
The fix is ruthless subtraction. Start by removing every indicator that duplicates another tool’s job; if you use an exponential moving average to gauge trend direction, delete your Parabolic SAR and your Supertrend immediately. You only ever need one reference point for market context, and anything beyond that simply creates decision fatigue.
Shift your eyes from the indicator sub-panels back to raw market structure. Swing highs, swing lows, and obvious liquidity pools tell you everything you need to know about buyer and seller aggression. When price sweeps a prior day low and aggressively closes back inside the range, that candlestick tells you institutions absorbed retail sell stops right now—not five bars later when an oscillator wakes up.
If you choose to keep an indicator on your chart, relegate it to an alert mechanism rather than an execution trigger. Use an oscillator strictly to highlight extreme divergence at major support or resistance, never to tell you when to click buy. If you cannot spot an edge on a clean candlestick chart within ten seconds, adding mathematical clutter will never manufacture one for you.
When Multi-Indicator Setups Can Still Help
Multi-indicator setups can provide genuine value only when the tools you select measure fundamentally different dimensions of the market. Combining a single trend-tracking tool like a 50-period moving average with raw volume profile or order flow delta gives you independent, uncorrelated data streams. That is true technical confluence because volume and price location are entirely separate metrics.
Even in that scenario, the tools should only frame the environment while price action dictates the entry. Let your volume metric show you where heavy participation sits, use your moving average to keep you on the right side of the broader trend, and pull the trigger based strictly on the immediate candle reaction.
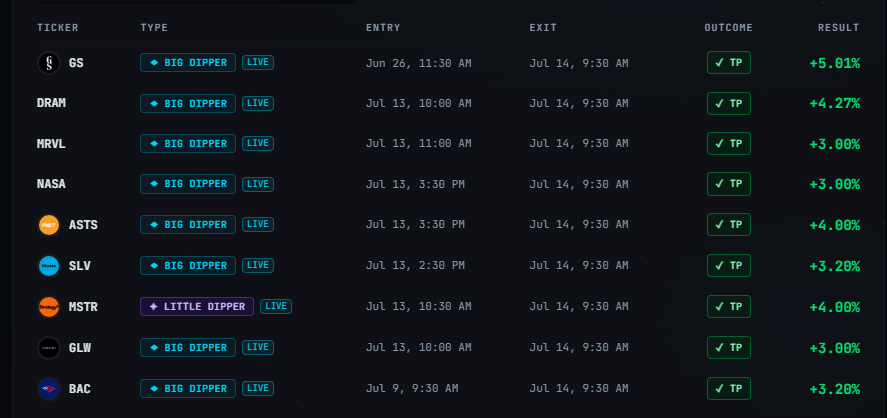
🎯 Want Setups Like These? The Big Dipper Does the Scanning For You.
Every morning the Big Dipper delivers curated DIP ZONE trade ideas — stocks already at high-probability entry levels, with targets pre-set. No guessing, no scanning. Just setups.

Indicator Overload FAQ
Q: How many indicators should I realistically have on my trading chart?
A: Stick to a maximum of one or two non-correlated tools, such as a single moving average for trend bias and a volume profile for key horizontal levels. Anything more creates conflicting signals and forces you into late, low-probability entries.
Q: Why do my momentum indicators constantly give conflicting signals at major levels?
A: Indicators use different lookback periods and smoothing algorithms, which causes fast oscillators to register overbought conditions while slower trend tools still point upward. These mathematical discrepancies inevitably clash during choppy consolidation, creating paralysis right when you need absolute clarity.
Free For Traders
Get Free Weekly Trade Ideas Sent Straight To Your Phone
Join thousands of traders who get high-probability setups delivered every week — no cost, no catch.

From Find Better Trades
The Pullback Isn’t A Warning. It’s Your Entry.
Slingshot catches the exact moment a trend pause is ready to rip back in your favor — built for explosive pullback continuations.

📈 Want More? Join Our Free Trading Community
- Trading Strategy Guides Telegram — daily strategy tips and market insights
- Find Better Trades Telegram — free trade signals delivered to your phone
- Find Better Trades on YouTube — live trade breakdowns and tutorials


