
Stop Buying the 50 EMA Touch: How Pros Actually Trade Dynamic Support

📊 September 28, 2026
- The 50 EMA is an intermediate trend gauge, not a magical floor where institutional bids sit waiting for you.
- Blindly placing limit buy orders on dynamic moving average touches guarantees you will get wicked out by routine liquidity sweeps.
- Wait for price to probe through the 50 EMA into horizontal market structure and reclaim the line before risking your capital.
— Ben, Find Better Trades
Most retail trading tutorials treat the 50 EMA like a literal trampoline where institutional algorithms blindly throw millions of dollars at every single touch. I watch amateur traders buy those touches every single week, only to get wicked out seconds before the real expansion leg begins. If your entire trading plan comes down to placing a resting limit order on a curved blue line, you are someone else’s liquidity.
Why Everyone Gets This Wrong
Retail traders are taught that dynamic support functions just like static horizontal support, only tilted on an angle. You see a stock in a clean uptrend, notice it pulling back toward the 50 EMA, and immediately throw a limit buy order directly on the moving average. You tuck your stop loss five or ten ticks below the line because that is what basic textbook theory told you to do.
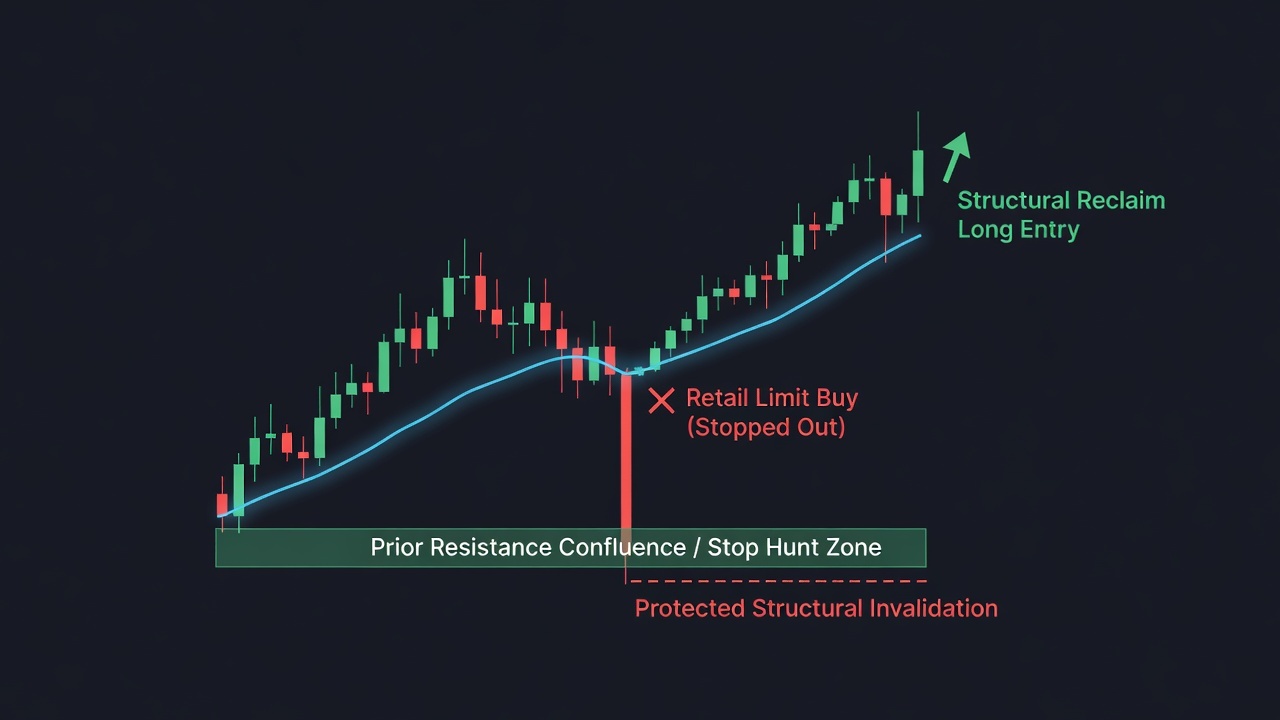
Large market participants know this exact habit, and they exploit it relentlessly. When price retraces toward a widely watched moving average, institutional desks do not rush to absorb selling pressure early and give retail traders a frictionless fill. Instead, they allow price to slice straight through the moving average line to target the dense cluster of retail stop-loss orders stacked just below it.
Consider a classic momentum chart where a stock pushes up from 100 to 140 and begins a slow, corrective bleed back down toward the 50 EMA sitting at 122. Retailers pile into long positions precisely at 122 with stops at 120. Institutional selling drives price down to 118, triggering a cascade of retail stop-market orders that hand institutions the exact cheap liquidity they need to build their positions.
Once those stops are flushed, price violently snaps back above 122 and rips toward new highs without the retail herd on board. You were dead right about the macro direction, but you lost money anyway because you treated a calculated mathematical average like an impenetrable wall.
What Actually Works
Professional traders treat the 50 EMA as a value zone of interest, never as an execution trigger on its own. The first thing I look for is structural confluence, meaning I want to see an old horizontal breakout level or prior resistance shelf lining up near the moving average. If the 50 EMA is floating in empty air with no horizontal market memory behind it, the line means almost nothing.
Second, stop front-running the test and start trading the liquidity sweep and reclaim. Let the candle deliberately breach the 50 EMA, flush out the nervous longs, and tap into the underlying horizontal support zone. What you want to see is an immediate rejection wick that drags price right back across the moving average before the candle closes.
Your actual trigger is the candle close back above the 50 EMA, confirmed by a shift in lower-timeframe market structure. By waiting for the reclaim, you let the institutions do the heavy lifting of absorbing sell orders instead of trying to catch a falling knife with your own account balance.
This setup gives you an objective, unshakeable invalidation point. Instead of guessing where to hide your stop, your risk goes directly below the sweep wick’s swing low. If price breaks that swing low, the structure has genuinely failed, and you can exit with minimal, planned damage.
When the 50 EMA Can Still Help
The 50 EMA remains one of my favorite visual filters for identifying the intermediate trend state at a glance. When price is comfortably above an upward-sloping 50 EMA, shorting intraday dips is statistically terrible business, and forcing yourself to look exclusively for long reclaims keeps you completely aligned with higher-timeframe order flow.
It also functions as an exceptional gauge for trend health during orderly consolidations. When pullbacks to the 50 EMA occur on shrinking volume and tight candle spreads, the market is telling you that aggressive sellers are entirely absent and that the trend is merely digesting gains before continuation.
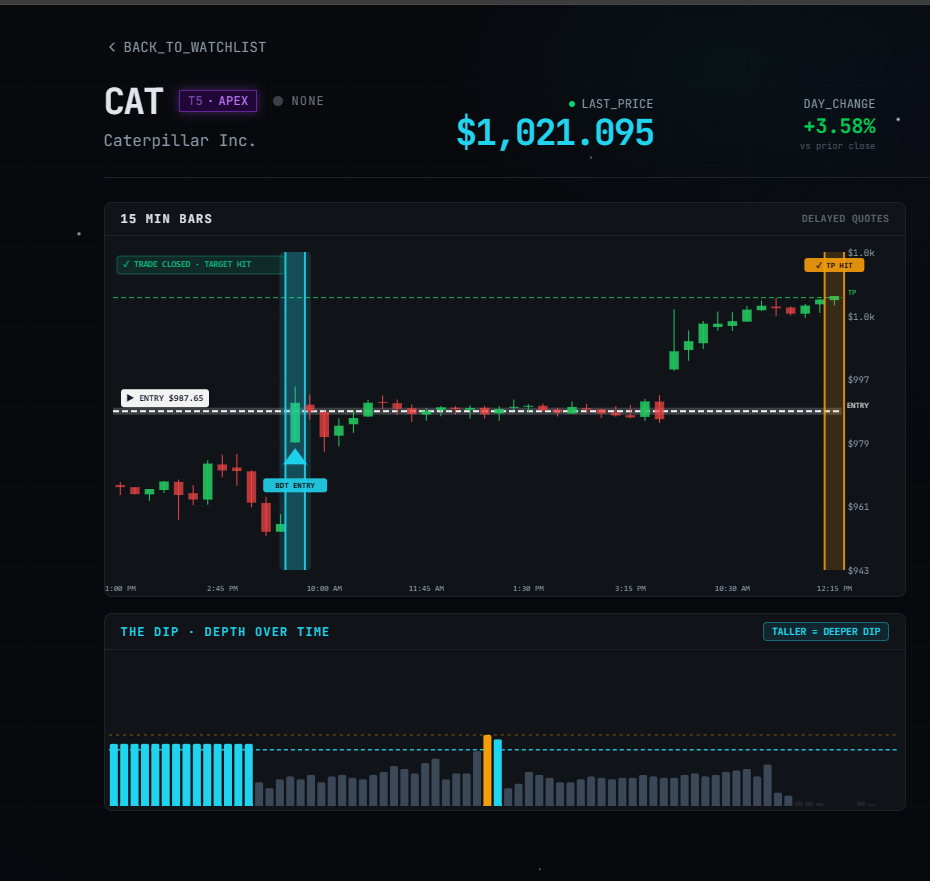
🎯 Want Setups Like These? The Big Dipper Does the Scanning For You.
Every morning the Big Dipper delivers curated DIP ZONE trade ideas — stocks already at high-probability entry levels, with targets pre-set. No guessing, no scanning. Just setups.

50 EMA Dynamic Support FAQ
Q: What timeframe works best when using the 50 EMA as dynamic support?
A: The daily and 4-hour charts offer the most reliable signals because institutional algorithms utilize these higher timeframes to evaluate intermediate market health.
Q: Should I use the 50 EMA or 50 SMA for dynamic support levels?
A: Use the 50 EMA because its exponential weighting prioritizes recent price velocity, allowing you to spot structural reclaims much faster than a lagging simple average.
Free For Traders
One Clear Arrow. Every High-Probability Setup. Free.
The Fusion Indicator combines multiple signals into a single buy/sell arrow on TradingView so you never miss a move.

From Find Better Trades
One Stock. Explosive Windows. Focused Profits.
Hyper-focused NVDA scalping service targeting the stock’s most explosive intraday windows.

📈 Want More? Join Our Free Trading Community
- Trading Strategy Guides Telegram — daily strategy tips and market insights
- Find Better Trades Telegram — free trade signals delivered to your phone
- Find Better Trades on YouTube — live trade breakdowns and tutorials


