
Stop Drawing Lines: How to Find Real Support and Resistance

📊 September 27, 2026
- Thin horizontal lines on a chart are an illusion that big money uses to harvest your stops.
- Treating single price points as unbreakable floors guarantees you get shaken out by routine liquidity sweeps.
- Map high-timeframe order zones based on aggressive volume displacement, then wait for confirmation before entry.
— Ben, Find Better Trades
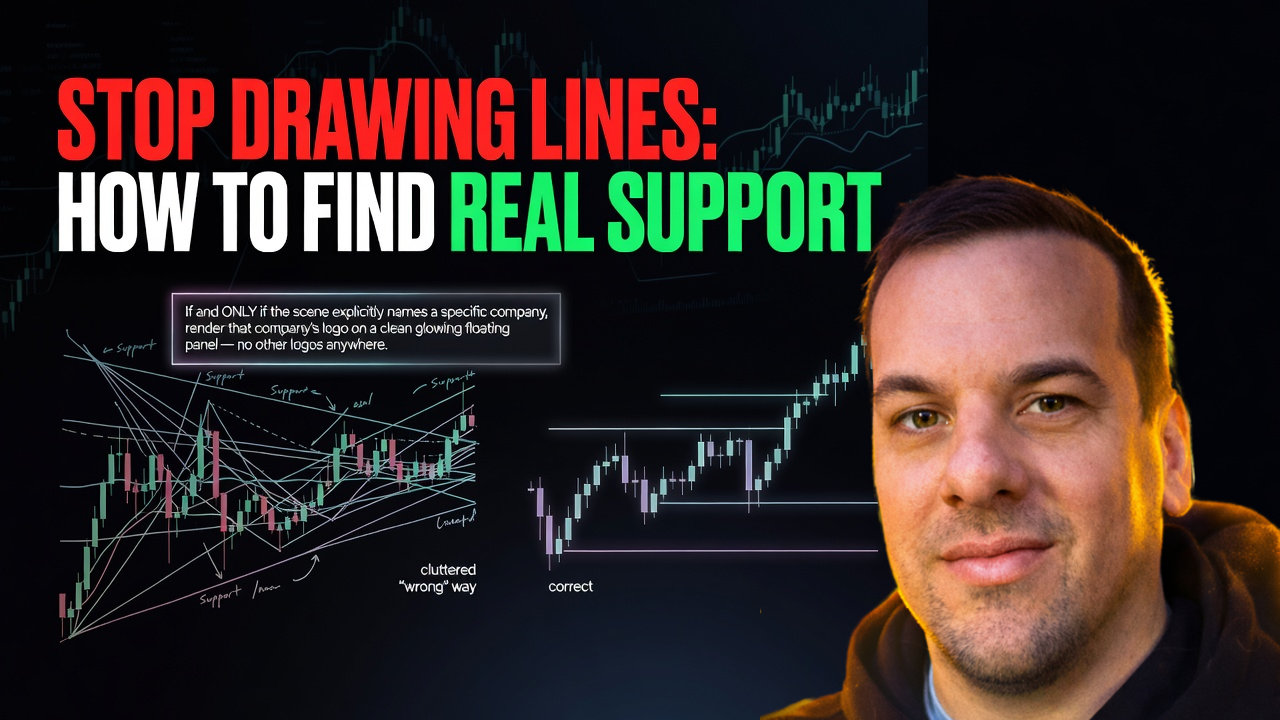
Most retail charts look like an explosion of colored lines where actual price action is completely hidden. If you are tracking fifteen different horizontal levels between last week’s low and yesterday’s close, you don’t have an edge—you have noise. The market does not care about your single-pixel line drawn across three candle wicks, and believing it does is why you keep funding other traders’ accounts.
Why Everyone Gets This Wrong
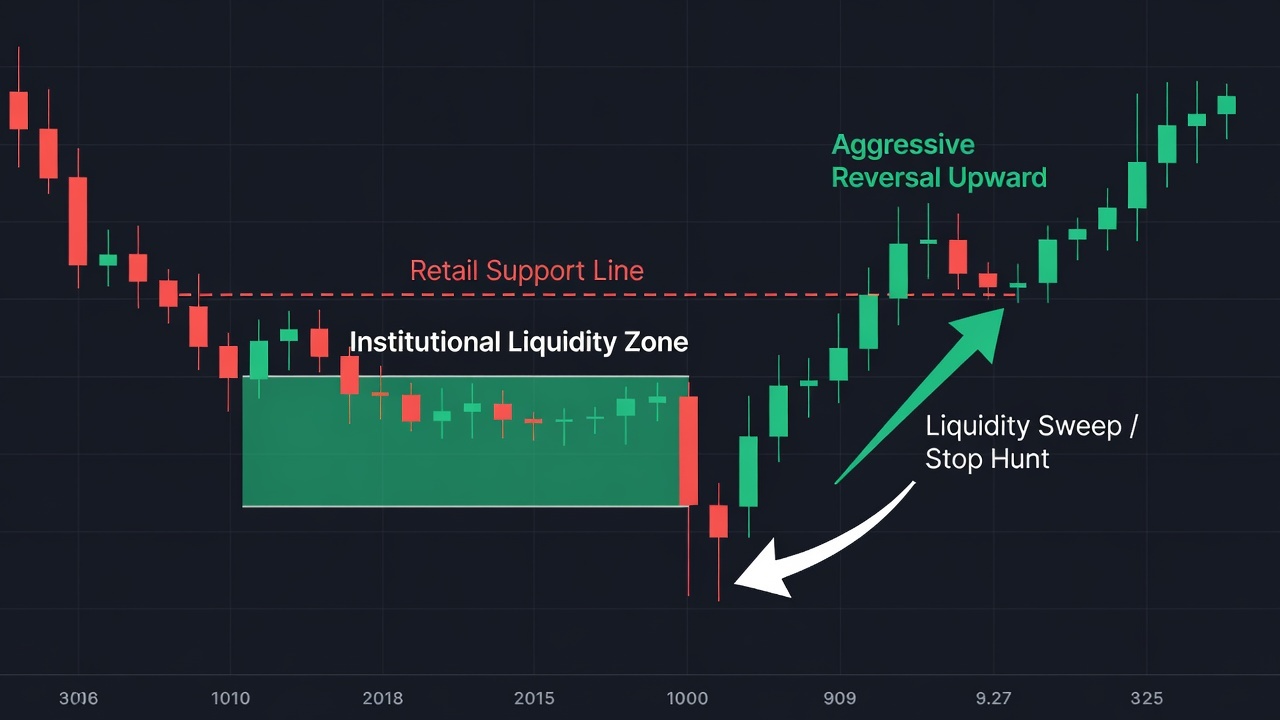
Conventional trading books teach you to connect three highs, draw a line, and expect price to bounce off it to the penny. Retail traders anchor their entire thesis to an exact figure like $142.50 and shove their stop loss twenty cents beneath it. That predictable behavior creates a cluster of resting orders sitting right in the open.
Institutional desks need massive liquidity to fill their books without slipping the market against themselves. When price approaches an obvious support line, smart money does not step in to defend your level; they let price breach it on purpose. That engineered dip triggers thousands of automated retail stop-loss market sells, handing large players the cheap shares they need.
You watch price slice straight through your level, take your capital, and immediately rip upward toward your original target. You did not spot a real support barrier. You simply identified where retail stops were pooled for the taking.
What Actually Works
Strip every arbitrary line off your screen and start mapping wide price zones anchored to higher-timeframe consolidation bases. Real support and resistance are dynamic supply and demand bands where massive volume previously forced price to violently displace away from equilibrium. Look for the base of strong, impulsive daily candles rather than neat wick taps on a five-minute chart.
When you spot the origin of an aggressive breakout, shade the entire range from the consolidation candle bodies down to the lowest wick. That entire spread is your reaction zone, not a single price tick. This shift immediately stops you from panicking during standard intraday retests that briefly pierce obvious levels.
Heading into Monday, look for how price interacts with these higher-timeframe zones instead of setting blind limit orders. Wait for the market to sweep into the zone, flush out late sellers, and print an aggressive reclamation bar before risking a dollar. Let the institutional players do the heavy lifting before you join the move.
When Classic Levels Can Still Help
Traditional horizontal levels are not completely useless if you stop treating them as brick walls and start treating them as liquidity targets. Obvious prior swing highs and major round numbers act like magnets because trapped positions cluster right beyond those boundaries.
Use classic horizontal levels to pinpoint where other traders will panic or get forced out, creating the ideal spot for you to harvest profit. When you view these levels as areas for potential stop runs rather than guaranteed pivot points, your entire perspective shifts.
🎯 Want Setups Like These? The Big Dipper Does the Scanning For You.
Every morning the Big Dipper delivers curated DIP ZONE trade ideas — stocks already at high-probability entry levels, with targets pre-set. No guessing, no scanning. Just setups.


Support and Resistance FAQ
Q: How many support and resistance levels should I have on my chart at once?
A: Keep no more than two or three major zones active at any time, plotted exclusively from higher timeframes. Plotting too many minor intraday levels leads to analysis paralysis and hesitation during rapid market moves.
Q: Does a support level get stronger every time price bounces off it?
A: No, that is an outdated myth because repeated tests actually consume resting limit orders and weaken the barrier. With each subsequent touch, the zone becomes significantly more vulnerable to an aggressive institutional breakout.
Free For Traders
One Clear Arrow. Every High-Probability Setup. Free.
The Fusion Indicator combines multiple signals into a single buy/sell arrow on TradingView so you never miss a move.

From Find Better Trades
Green Light Means GO. It’s That Simple.
Clear signals for directional options plays — momentum plus chain data tells you exactly which strike to buy.

📈 Want More? Join Our Free Trading Community
- Trading Strategy Guides Telegram — daily strategy tips and market insights
- Find Better Trades Telegram — free trade signals delivered to your phone
- Find Better Trades on YouTube — live trade breakdowns and tutorials


