Higher Timeframe Levels Always Crush Your 5-Minute Noise


📊 September 21, 2026
- Daily and weekly support and resistance levels dictate market direction, making lower timeframe levels statistically irrelevant noise.
- Traders clutter their charts with dozens of 5-minute pivots that institutional order flow plows through without flinching.
- Anchor your entire bias to higher timeframe key zones, and touch lower timeframes only to refine your execution trigger.
— Ben, Find Better Trades
If you are staring at a 5-minute chart right now wondering why your clean horizontal line just failed for the third time today, stop blaming manipulation. Your level did not fail because the market is rigged against you. It failed because your level does not exist to the market participants who actually move price.
Every time you draw a support line on an intraday timeframe without looking at the higher timeframe context, you are flipping a coin against a loaded deck. Real institutional volume operates on horizons measured in days, weeks, and quarters. If you want consistency, you have to align with the only structural barriers that capital actually respects.
Why Everyone Gets This Wrong
Retail traders are addicted to precision over significance. They drop down to the 5-minute or 1-minute chart, spot three touches of a micro-pivot, and treat it like the Great Wall of China. The reality is that lower timeframe charts do not contain distinct auction decisions; they simply show the granular mechanical delivery of orders created on higher timeframes.
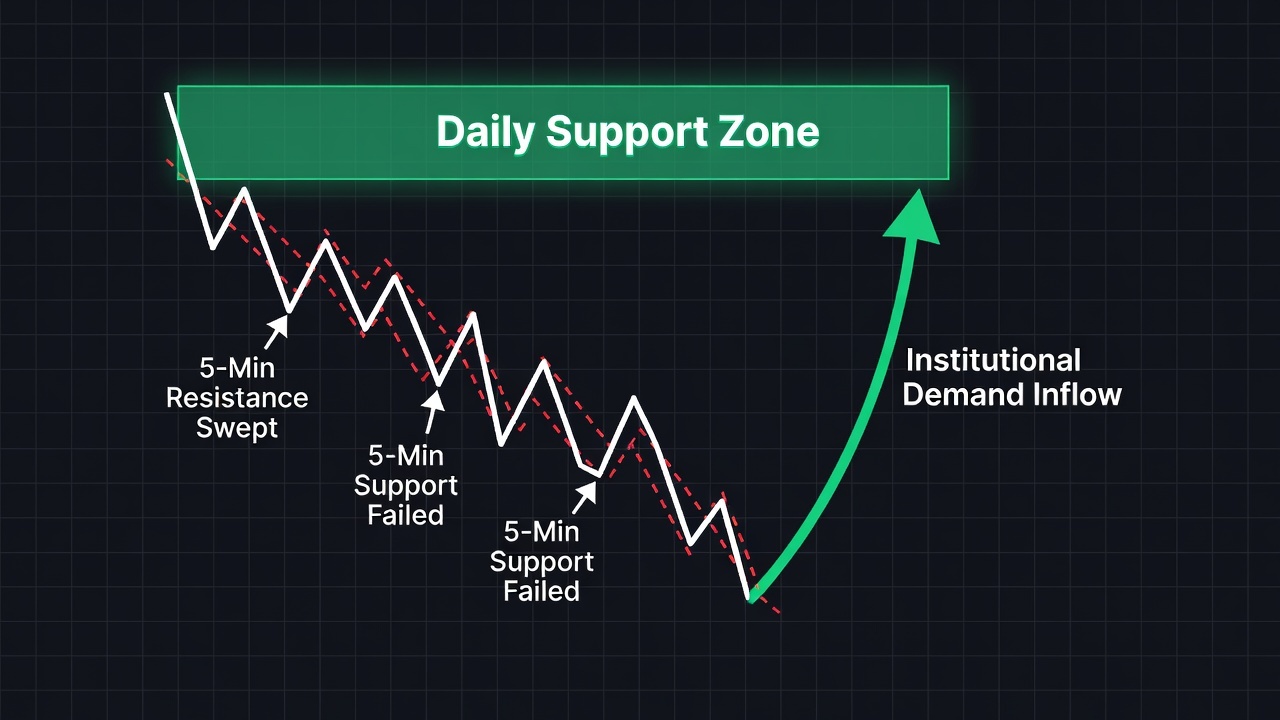
Consider a plausible technical setup where an asset is sliding into a massive daily demand zone that has repelled sellers twice over the past month. A day trader sitting on a 5-minute chart spots a clean lower-high resistance shelf fifty cents above price and decides to take a short position into the breakdown. Ten minutes later, price obliterates that resistance shelf with a single 100-tick candle, taking out their stop loss instantly.
The trader cries foul and claims an institutional stop hunt targeted their specific retail order. What actually happened was entirely mechanical: a multi-million-dollar institutional purchase order sitting resting in the daily demand zone filled. That single macro order consumed every ounce of resting liquidity, completely ignoring the micro-resistance level because micro-resistance does not have enough liquidity to absorb institutional capital.
When you trade intraday support and resistance in isolation, you are trying to predict the path of a tidal wave by watching the ripples around your ankles. Lower timeframe levels break constantly because they are structurally fragile. They represent minor imbalances that take almost no volume to override.
What Actually Works
You must flip your entire analytical hierarchy upside down. Strip every single horizontal ray, trendline, and indicator band off your intraday screens before you take another trade. Open your charts on the daily timeframe and mark only the obvious swing points where price violently reversed and left clear imbalances behind.
Next, define those levels as dynamic zones rather than razor-thin lines. When an institution enters the market at daily support, they cannot fill their entire inventory at a single price point; they accumulate across a defined spread. Once you mark these broad macro zones, set alerts on your platform and deliberately step away from the charts until price arrives at those exact coordinates.
When price finally tests that daily support zone, that is the only moment you drop down to an intraday timeframe. You do not blind-buy the level; you watch the 5-minute or 15-minute chart for a confirmation of institutional absorption, such as a sharp failure to push lower followed by a structural break to the upside. You are using the lower timeframe strictly as a microscope to time your entry, never as the architect of your trade idea.
This simple habit shifts your win rate instantly because you are entering trades where heavy liquidity pools exist. Your stop losses sit beyond structural macro barriers that require real institutional selling power to violate, rather than minor intraday swings that an off-market algorithmic sweep can trigger by accident.
When Intraday Levels Can Still Help
Lower timeframe support and resistance is not completely useless, but its utility is strictly tactical rather than strategic. Once price has confirmed a reversal off a verified daily or weekly level, intraday pivots become excellent targets for partial profit-taking or trailing your stop loss. They help you milk momentum inside an already confirmed higher timeframe impulse.
Intraday levels also provide immediate warning signs when a trade is losing momentum. If price bounces off daily support, surges forward, and then fails to hold an immediate 15-minute higher low, that quick breakdown gives you an early warning to scratch the trade before your daily stop gets threatened. Use micro-structure to manage risk, never to justify putting capital on the line in the first place.
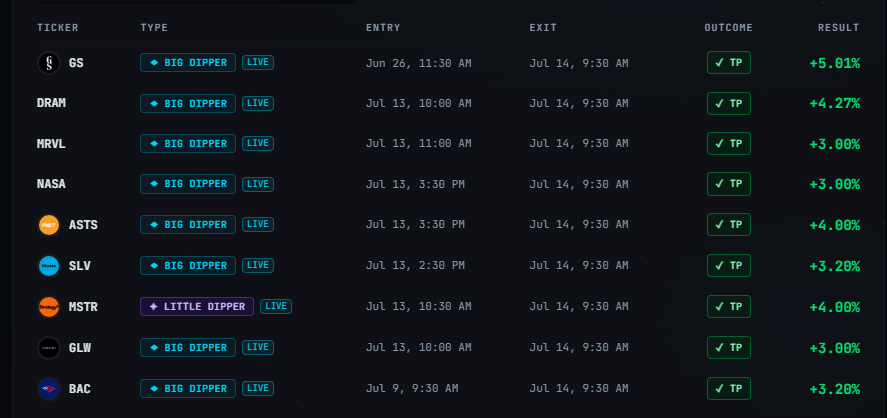
🎯 Want Setups Like These? The Big Dipper Does the Scanning For You.
Every morning the Big Dipper delivers curated DIP ZONE trade ideas — stocks already at high-probability entry levels, with targets pre-set. No guessing, no scanning. Just setups.

Support and Resistance Timeframe FAQ
Q: Which timeframe is best for drawing support and resistance?
A: The daily and 4-hour charts provide the cleanest, highest-probability support and resistance zones for both swing traders and active day traders. Anything below the 1-hour chart contains too much noise to establish a primary directional bias.
Q: Can a 5-minute support level hold if the daily trend is strong?
A: No, an intraday support level standing directly in front of a strong daily trend will almost always be swept for liquidity. Trading a 5-minute counter-trend level against higher timeframe order flow is the fastest way to bleed capital.
Free For Traders
This Free Indicator Finds Overbought & Oversold Levels For You
Add the Red & Green Zone indicator to TradingView at zero cost. It does the level-hunting automatically on any chart.

From Find Better Trades
Only Trade When Momentum Is HEAVILY In Your Favor
The Power Index oscillator measures trend conviction at a glance — it filters out weak, choppy action so you only take the strong moves.

📈 Want More? Join Our Free Trading Community
- Trading Strategy Guides Telegram — daily strategy tips and market insights
- Find Better Trades Telegram — free trade signals delivered to your phone
- Find Better Trades on YouTube — live trade breakdowns and tutorials