
Bollinger Bands + Price Action: Spotting Fakeouts Before They Happen

📊 September 15, 2026
- Bollinger Bands do not mark rigid support and resistance, and trading band taps as automatic reversals is why retail accounts bleed out.
- The common mistake is either blindly fading every outer band touch or recklessly buying candles that close outside the band during low-volatility regimes.
- Wait for a violent poke outside the envelope that closes back inside with a clear rejection wick, paired with a curling opposite band, to fade the trapped liquidity.
— Ben, Find Better Trades
Retail trading gurus love preaching that Bollinger Bands are an easy overbought and oversold cheat code. That advice is pure poison for your trading account. The second you stop treating the outer envelopes like hard brick walls, you stop donating your capital to smart money liquidity grabs.
Why Everyone Gets This Wrong
Amateur traders see price push into an upper band and immediately hit the short button. What they miss is that strong trending assets routinely walk the band for days, steamrolling anyone attempting to pick a top. The bands measure standard deviation relative to a simple moving average, which means they measure volatility, not institutional supply or demand.
Other traders make the opposite mistake by chasing breakouts the second a green candle peeks past the band. If you buy an envelope breach without examining whether volatility is actually expanding, you are walking straight into a trap. Price quickly exhausts itself, leaving you holding positions at the absolute high of a temporary volatility stretch.
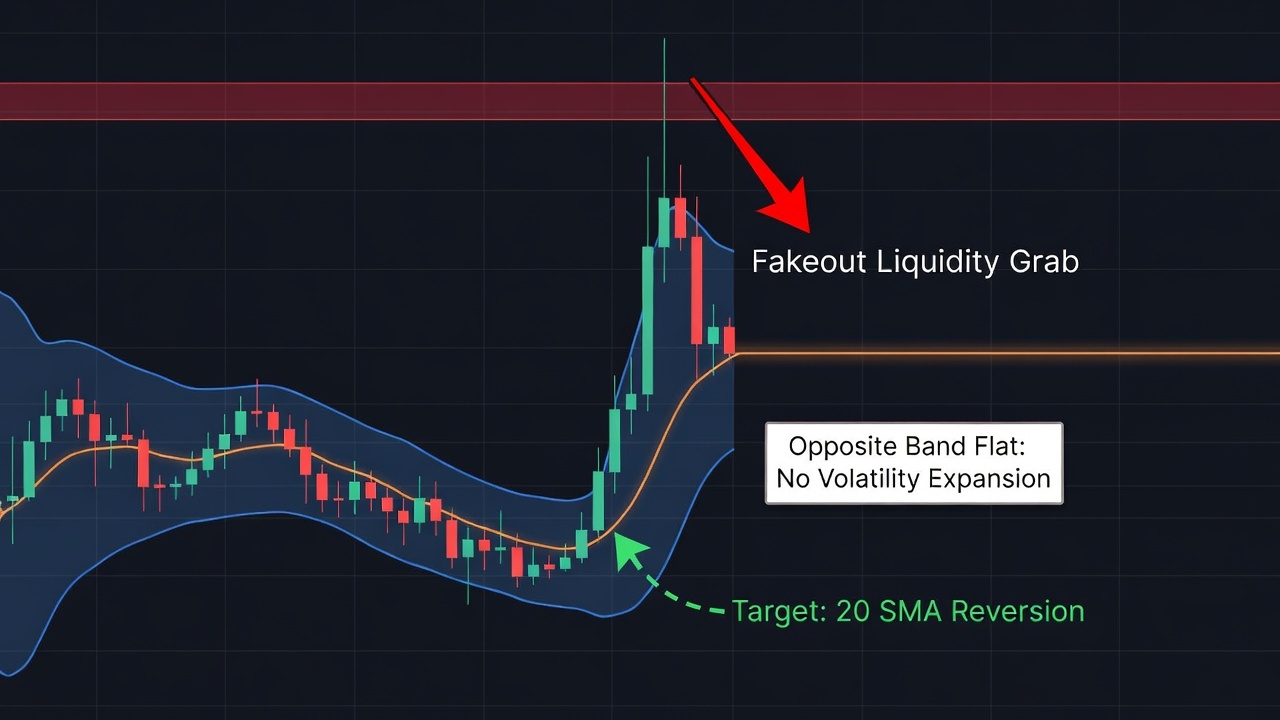
Think about a standard consolidation box where price drifts upward on thinning volume. A single aggressive bar surges two ticks above the upper band, triggering breakout stops and sucking in market buyers. Two bars later, price drops right back inside the band while the lower band remains completely flat, leaving those breakout buyers trapped and forced to liquidate.
What Actually Works
I wait for one specific sequence: the rejection close back inside the envelope. When price pushes through the upper band into a key horizontal resistance level, I ignore the poke and watch the close. If the candle prints a distinct rejection wick outside the band and closes firmly back inside the envelope, the breakout has officially failed.
Next, look at the opposing band to verify the fakeout. In a genuine explosive breakout, the opposite band flares outward aggressively like an open alligator jaw to accommodate surging volatility. If the lower band stays flat or starts curling upward while the upper band is tested, there is zero structural expansion backing that push.
That is your green light to fade the move straight back to the 20-period midline. Put your invalidation stop just above that rejection wick high, let the trapped breakout buyers panic out, and capture the fast mean-reversion move down to the central moving average.
When Bollinger Bands Can Still Help
Bollinger Bands are exceptional when used for their original intended purpose: diagnosing volatility compression. When both outer bands pinch tightly against the 20-period baseline, they signal that stored energy is building for a decisive structural move.
Treat the bands strictly as an alert mechanism for impending volatility and an envelope for spotting price rejection, never as standalone buy or sell signals. When you anchor band behavior to clear price action levels, you flip the odds permanently in your favor.
🎯 Want Setups Like These? The Big Dipper Does the Scanning For You.
Every morning the Big Dipper delivers curated DIP ZONE trade ideas — stocks already at high-probability entry levels, with targets pre-set. No guessing, no scanning. Just setups.


Bollinger Bands and Fakeouts FAQ
Q: Can I trade Bollinger Bands effectively without using price action?
A: No, because bands are purely mathematical derivatives of past prices and lag actual market shifts. Without watching candlestick closes and horizontal key levels, band touches will continuously fake you out.
Q: What chart timeframe is best for spotting Bollinger Band fakeouts?
A: The 1-hour and 4-hour timeframes work best because they filter out lower-timeframe noise while clearly displaying institutional liquidity grabs around the outer bands.
Free For Traders
The Options Cheat Sheet Thousands Of Traders Swear By
Calls, puts, spreads — one free download tells you the right options strategy for every market condition.

From Find Better Trades
Three Candles Tell You When The Move Accelerates
The 3-candlestick reversal pattern indicator that catches the exact moment momentum flips.

📈 Want More? Join Our Free Trading Community
- Trading Strategy Guides Telegram — daily strategy tips and market insights
- Find Better Trades Telegram — free trade signals delivered to your phone
- Find Better Trades on YouTube — live trade breakdowns and tutorials


