
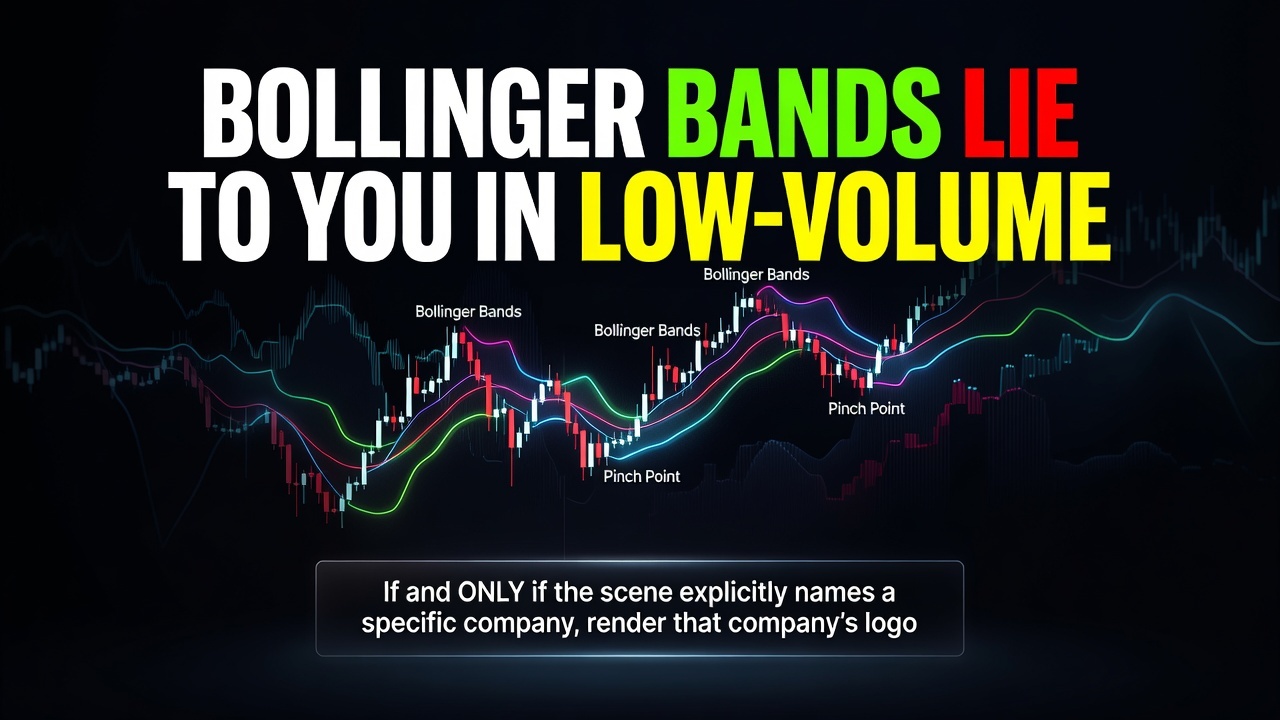
Bollinger Bands Lie to You in Low-Volume Stocks

📊 September 10, 2026
- Bollinger Bands are mathematically useless on low-volume stocks because standard deviation requires a continuous, liquid normal distribution to mean anything.
- Traders confuse an illiquid spread gap with actual volatility expansion, buying false breakout squeezes that collapse immediately.
- Screen for minimum average dollar volume first, and switch to ATR-based Keltner Channels anchored by volume profiles when trading thin names.
— Ben, Find Better Trades
If you trade low-volume stocks using Bollinger Bands, you are setting your cash on fire. You see a squeeze, you see price pierce the upper band, and you hit market buy thinking a massive breakout just started. What you actually bought was a single retail market order lifting a wide ask spread in a ghost town.
The bands did not signal a structural trend transition. They merely reacted to bad data, expanding because standard deviation cannot tell the difference between institutional buying and illiquid friction.
Why Everyone Gets This Wrong
John Bollinger built these bands on a 20-period simple moving average flanked by two standard deviations. That math works under one strict assumption: that the underlying asset trades in a liquid, continuous auction. When liquidity dries up, that mathematical foundation completely disintegrates.
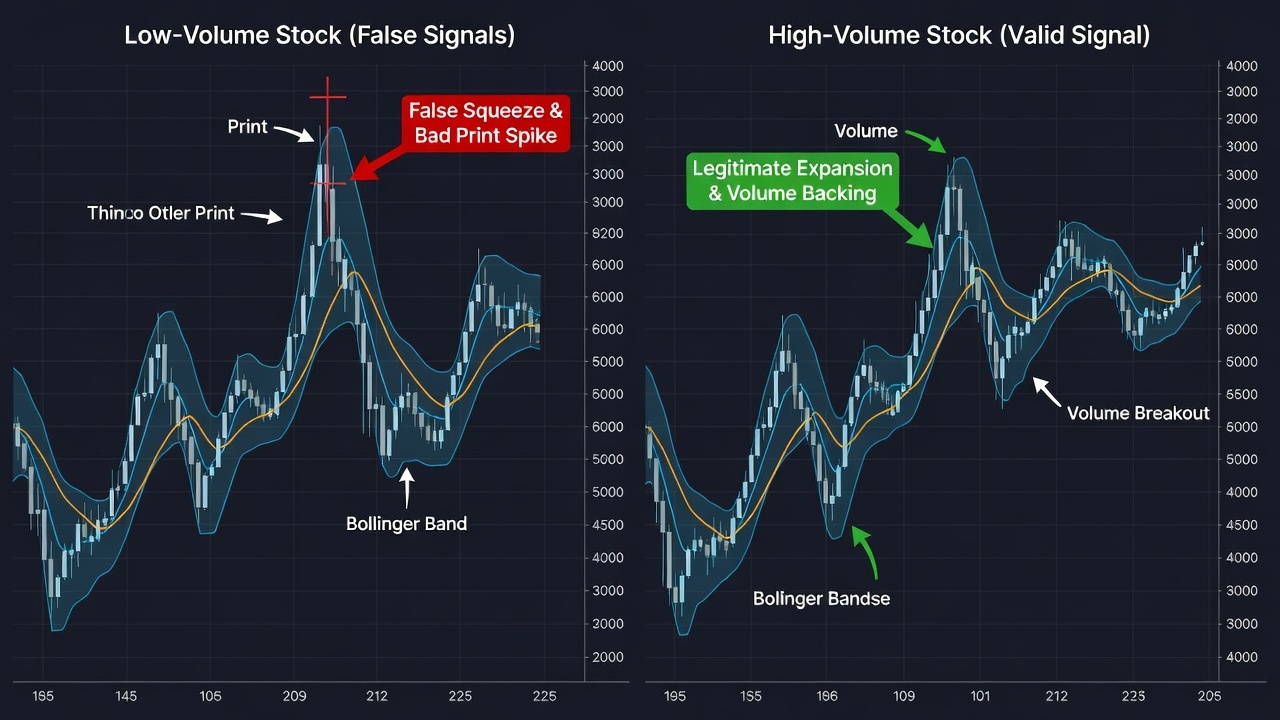
In low-volume names, price does not move in fluid waves. It jumps across fragmented bid-ask spreads with giant gaps between printed trades. Because standard deviation squares the distance of each closing price from the mean, a single stray tick through a wide spread violently stretches the bands outward.
Consider an illiquid micro-cap trading 40,000 shares a day where the bid is $5.10 and the ask is $5.35. A tiny retail order clears the book up to $5.45, instantly throwing the closing print far outside the 20-period average. To your Bollinger Band scan, this prints an explosive volatility expansion breakout from a tight squeeze.
You pile in on the band-walk signal expecting follow-through momentum. Two minutes later, the next printed trade drops back to the real bid at $5.12 because there were no resting limit orders behind the move. The upper band immediately rolls over, your stop gets triggered at a massive loss, and you sit there wondering why the textbook pattern failed.
The pattern did not fail; your input data was garbage. Low-volume tickers produce synthetic squeezes when trading stops occurring, followed by fake expansions caused purely by liquidity voids. You are not measuring market sentiment; you are measuring market neglect.
What Actually Works
Stop applying liquid-market statistical tools to illiquid order books without filtering volume first. My absolute non-negotiable rule is simple: if a stock trades less than 500,000 shares a day or under two million dollars in daily turnover, standard deviation volatility bands get stripped off my chart immediately.
When I trade lower-liquidity setups, I replace Bollinger Bands with Keltner Channels set to an Average True Range (ATR) multiplier. ATR measures absolute price displacement over time rather than squaring standard deviations. This prevents single erratic ticks from artificially ballooning your channel width and feeding you phantom breakout triggers.
Next, you must anchor your execution to a Volume Weighted Average Price (VWAP) and horizontal liquidity shelves rather than dynamic curving bands. In thin tickers, institutional participants do not care about an arbitrary statistical band two deviations away from a moving average. They care about where real blocks of shares traded, which shows up exclusively on your volume profile.
Combine an ATR channel with a volume threshold filter: look for a genuine consolidation near a structural volume node, wait for actual volume to print at least 2.5 times the 20-day average, and only then take the breakout. If the volume expansion is not present, every band touch is noise that should be completely ignored.
When Bollinger Bands Can Still Help
Bollinger Bands are not useless tools; they are specialized tools designed for high-turnover environments. They excel when applied to high-volume mega-caps, index ETFs like SPY and QQQ, and heavily traded futures contracts. In those liquid arenas, the auction is continuous, the order book is deep, and standard deviation accurately captures true distributional extremes.
When two million shares trade every five minutes, an upper band touch genuinely reflects two standard deviations of extreme demand against deep resting liquidity. You can reliably use Bollinger Band squeezes and walks on Apple or the S&P 500 because the math matches the underlying market structure. Just keep them far away from illiquid charts where standard deviation has no business being calculated.
🎯 Want Setups Like These? The Big Dipper Does the Scanning For You.
Every morning the Big Dipper delivers curated DIP ZONE trade ideas — stocks already at high-probability entry levels, with targets pre-set. No guessing, no scanning. Just setups.


Bollinger Bands in Low-Volume Stocks FAQ
Q: Why do Bollinger Bands tighten so much on low-volume stocks?
A: Bands pinch tightly on thin stocks simply because no shares are trading, causing consecutive closes to cluster artificially. This reflects a dead market with no liquidity, not an actionable coiled volatility squeeze ready to explode.
Q: What is the best indicator to replace Bollinger Bands on illiquid tickers?
A: Use Keltner Channels based on Average True Range (ATR) paired with a Volume Profile. ATR measures true linear price range without squaring outliers, preventing the erratic false signals that standard deviation generates on thin order books.
Free For Traders
The Options Cheat Sheet Thousands Of Traders Swear By
Calls, puts, spreads — one free download tells you the right options strategy for every market condition.

From Find Better Trades
Three Candles Tell You When The Move Accelerates
The 3-candlestick reversal pattern indicator that catches the exact moment momentum flips.

📈 Want More? Join Our Free Trading Community
- Trading Strategy Guides Telegram — daily strategy tips and market insights
- Find Better Trades Telegram — free trade signals delivered to your phone
- Find Better Trades on YouTube — live trade breakdowns and tutorials


