
Why On-Balance Volume Gets Ignored (And Why That Is Costing You)

📊 August 30, 2026
- On-Balance Volume is the single most underrated tool for spotting institutional positioning before price breaks out.
- Traders ignore OBV because they treat it like a bounded oscillator instead of tracking structural trendline breaks in cumulative volume.
- Draw trendlines and horizontal breakout levels directly on your OBV pane to front-run high-probability moves before Monday’s open.
— Ben, Find Better Trades
Retail traders love complex math on their charts. You load up four different smoothed momentum oscillators, tweak the settings until they look pretty, and then wonder why you get chopped to pieces on fakeouts.
Meanwhile, On-Balance Volume (OBV) sits in the dusty corner of basic charting packages, largely forgotten because it was invented decades ago. That collective apathy is your edge.
When you strip away the noise, price is just the advertising mechanism, but volume is the fuel. Ignoring cumulative volume flow is the fastest way to buy right into institutional distribution.
Why Everyone Gets This Wrong
Most traders treat volume as an afterthought or stare at isolated vertical histogram bars at the bottom of the screen. Looking at a single high-volume candle tells you activity happened, but it tells you nothing about the broader campaign behind that asset.
The standard mistake is treating OBV like an overbought/oversold indicator. Traders pull it up, notice the raw cumulative number is arbitrary—sometimes running in the millions or negative millions—and immediately dismiss it as unreadable.
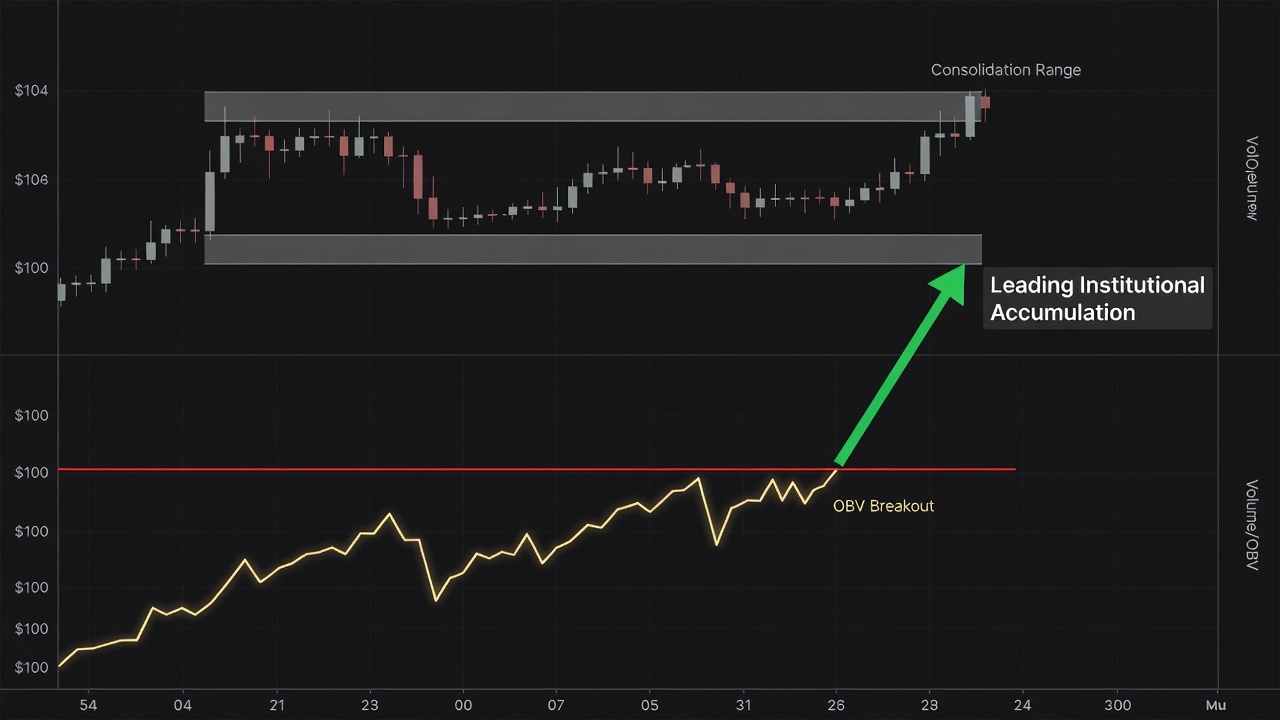
Consider a classic consolidation trap: a stock trades in a tight four-week range between $100 and $104. Price looks completely dead, forming lower highs that trick retail into opening short positions.
Underneath that flat price action, OBV is aggressively printing higher highs and higher lows because up-days carry triple the volume of down-days. Institutions are quietly absorbing every share available without pushing market orders, creating a massive divergence that retail completely misses until the stock gaps through resistance.
What Actually Works
Stop looking at the absolute value of the OBV line and start treating the OBV line as an asset chart of its own. I draw actual support, resistance, and diagonal trendlines directly across the OBV sub-panel.
When you see price stuck under a horizontal resistance level while OBV breaks cleanly above its corresponding volume resistance, you have leading accumulation. That is your cue that the eventual price breakout has legitimate institutional backing.
The reverse is equally lethal for warning you about bull traps. If price grinds upward to make a nominal new high while OBV fails to clear its previous peak, volume is drying up on the advance, meaning smart money is already distributing into liquidity.
As you build your watchlist heading into Monday, look for setups where OBV has already broken out of a multi-week consolidation pattern ahead of price. When markets open tomorrow, those are the tickers where supply is exhausted and price must reprice upward rapidly.
When OBV Can Still Help
OBV is not a standalone magic bullet, especially during low-liquidity holiday regimes or on micro-cap pump setups where volume spikes distort the cumulative running total for months. Its real power comes as an execution filter on liquid stocks, ETFs, and major futures contracts.
Use it specifically to validate your primary price action levels. If a support level on price is backed by strong ascending OBV, you can take pullbacks with tight invalidation and real confidence.
🎯 Want Setups Like These? The Big Dipper Does the Scanning For You.
Every morning the Big Dipper delivers curated DIP ZONE trade ideas — stocks already at high-probability entry levels, with targets pre-set. No guessing, no scanning. Just setups.


On-Balance Volume FAQ
Q: Can On-Balance Volume be used for intraday scalping?
A: Yes, but it functions best on higher-volume timeframes like the 5-minute or 15-minute charts rather than sub-minute tick noise where single block trades can temporarily skew the cumulative line.
Q: What should I do if OBV diverges from price for several weeks?
A: Always trust the volume divergence over price. A prolonged divergence indicates stealth accumulation or distribution that almost always resolves with price aggressively catching up to the OBV direction.
Free For Traders
The Options Cheat Sheet Thousands Of Traders Swear By
Calls, puts, spreads — one free download tells you the right options strategy for every market condition.

From Find Better Trades
Three Candles Tell You When The Move Accelerates
The 3-candlestick reversal pattern indicator that catches the exact moment momentum flips.

📈 Want More? Join Our Free Trading Community
- Trading Strategy Guides Telegram — daily strategy tips and market insights
- Find Better Trades Telegram — free trade signals delivered to your phone
- Find Better Trades on YouTube — live trade breakdowns and tutorials


