
Parabolic SAR Is a Lagging Trap Dressed Up as a Leading Tool

📊 August 29, 2026
- Parabolic SAR does not predict turns; it is a lagging mathematical trail that destroys capital the moment price consolidates.
- The fatal mistake is treating the dot flip as an early reversal entry signal instead of an exhausted reaction to past momentum.
- Use swing high/low market structure combined with an ATR-based trail when you build your watchlists for Monday’s open instead.
— Ben, Find Better Trades
Parabolic SAR gets pushed onto newer traders as an all-in-one system that magically spots exact tops and bottoms with tidy little dots. That premise is complete garbage. The indicator is a lagging formula anchored to trailing extremes, and treating it like a predictive entry trigger will bleed your account dry.
I have watched countless traders blow through their risk limits because they believed the dots gave them an early edge on reversals. When you look at how the math actually calculates, you realize it leads nothing.
Why Everyone Gets This Wrong
The standard textbook advice tells you to buy the second the dots flip beneath price and sell short the moment they flip above. This ignores how the acceleration factor actually works in real market conditions. The indicator requires price to set new extreme highs or lows just to tighten its trail, meaning it is purely reactive by design.
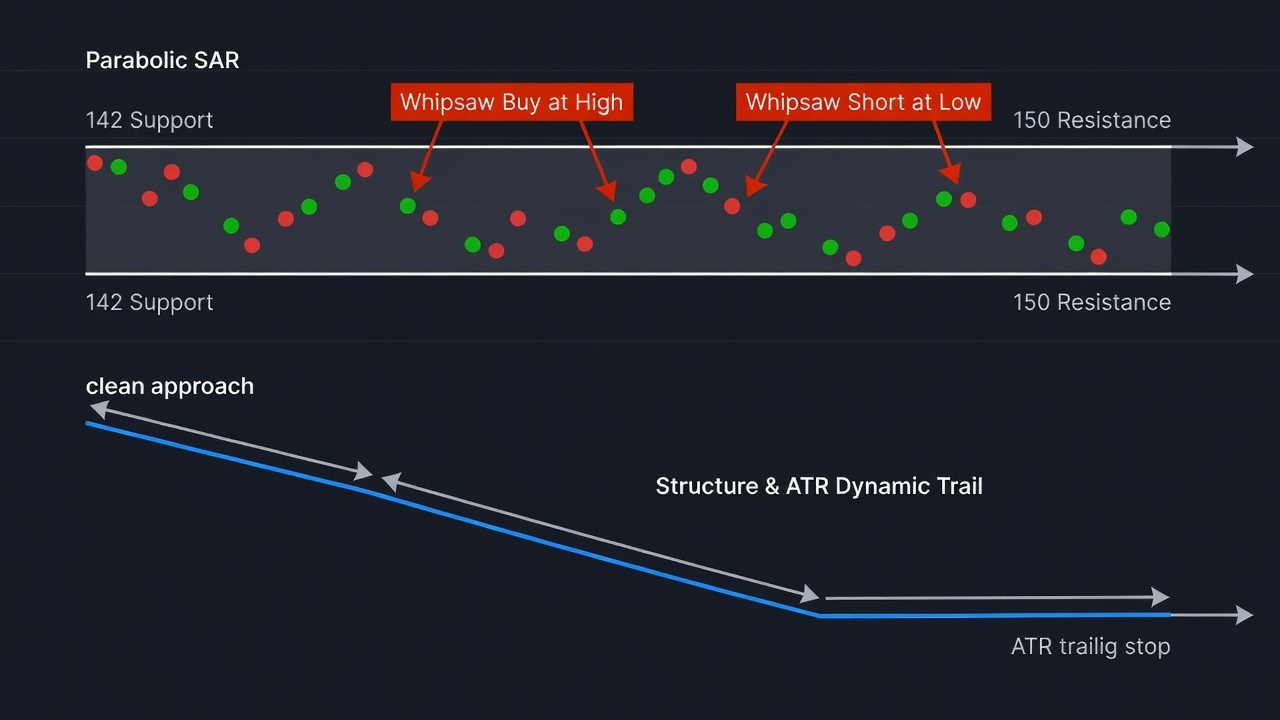
Consider a stock testing major resistance near $150 before pulling back into a support band at $142. As the stock drifts down into that support shelf, the Parabolic SAR dots flip above price, generating a flashing sell signal. Retail traders follow the dots and dump their positions or short the stock right into heavy resting bid liquidity. Two sessions later, buyers defend the $142 shelf, price rips back toward $148, and the short sellers are immediately trapped.
Because the indicator forces you into a binary stance at all times, it constantly manufactures whipsaws inside standard ranges. On a finished historical chart featuring a smooth 40-degree trend, Parabolic SAR looks brilliant. In live conditions where markets spend the majority of their time balancing and rotating, it serves as a relentless loss generator.
The dots flip late at the end of pullbacks and flip late at the top of bounces. You end up buying local highs and shorting into key support floors while congratulating yourself on following a system.
What Actually Works
If you want a dependable trailing method, ditch the fixed acceleration dots and map genuine market structure. Real institutional order flow defends structural swing lows in an uptrend and swing highs in a downtrend, not arbitrary mathematical curves plotted on your screen.
Heading into next week, mark clear higher-low pivot points on your daily and 4-hour charts instead of relying on indicator flips. When you enter a trend continuation setup, place your stop beneath the structural invalidation level where the trade idea actually fails. This keeps your stop anchored to actual supply and demand dynamics rather than algorithmic drift.
If you want a dynamic volatility trail, switch to an Average True Range (ATR) trailing stop anchored to an exponential moving average. A 2.5-times ATR buffer around a 20-period EMA breathes with market volatility without accelerating prematurely into tight consolidations. That simple adjustment prevents you from getting kicked out of healthy pullbacks before the real trend extension begins.
Let price action dictate your bias first, identify where liquidity rests, and execute only when your structural levels are confirmed on Monday’s open.
When Parabolic SAR Can Still Help
Parabolic SAR has exactly one legitimate use case: serving as a strictly mechanical, hands-off exit tool during runaway momentum moves. When a stock enters an aggressive expansion phase with vertical volume and no clean swing pullbacks, the acceleration factor can help you lock in outlier gains before the inevitable mean reversion hits.
Just remember that it is purely an exit mechanism for existing runners, never an entry trigger and never a standalone strategy.
🎯 Want Setups Like These? The Big Dipper Does the Scanning For You.
Every morning the Big Dipper delivers curated DIP ZONE trade ideas — stocks already at high-probability entry levels, with targets pre-set. No guessing, no scanning. Just setups.


Parabolic SAR FAQ
Q: Is Parabolic SAR a leading or lagging indicator?
A: Parabolic SAR is strictly a lagging indicator because its calculation depends entirely on past price extremes and an arbitrary acceleration factor. It reacts to where price has already traded rather than forecasting future directional movement.
Q: What is the best alternative to Parabolic SAR for setting trailing stops?
A: The best alternative is trailing stops behind key market structure swing points or utilizing an ATR-based trail anchored to a moving average. These methods account for real order flow support and natural asset volatility rather than accelerating blindly into standard pullbacks.
Free For Traders
One Clear Arrow. Every High-Probability Setup. Free.
The Fusion Indicator combines multiple signals into a single buy/sell arrow on TradingView so you never miss a move.

From Find Better Trades
Only Trade When Momentum Is HEAVILY In Your Favor
The Power Index oscillator measures trend conviction at a glance — it filters out weak, choppy action so you only take the strong moves.

📈 Want More? Join Our Free Trading Community
- Trading Strategy Guides Telegram — daily strategy tips and market insights
- Find Better Trades Telegram — free trade signals delivered to your phone
- Find Better Trades on YouTube — live trade breakdowns and tutorials


