
ADX Won’t Save You From Choppy Markets — Here’s Why

📊 August 28, 2026
- Relying on ADX to filter out choppy markets guarantees you will buy tops late and miss the best breakout entries entirely.
- The indicator’s double-smoothed 14-period calculation creates massive lag, flagging a market as “flat” right when the cleanest breakout begins.
- Trade structural price compression and volatility expansion directly on the chart rather than waiting for an oscillating math formula to give you permission.
— Ben, Find Better Trades
Retail trading textbooks love telling you that an ADX reading below 20 is your magic shield against choppy price action. They are completely wrong.
If you rely on the Average Directional Index to tell you when a market is chopping versus trending, you are guaranteed to bleed capital. You end up sitting on your hands during explosive moves and entering right when momentum dies.
Why Everyone Gets This Wrong
The standard playbook tells you to check the 14-period ADX before every trade: below 20 or 25 means chop, above 25 means a strong trend. It sounds clean and systematic, but it completely ignores how the indicator’s math actually functions.
ADX is a double-smoothed moving average of the difference between positive and negative directional movement over a trailing lookback window. That double smoothing is death for active traders. By the time the line reacts to real market dynamics, the conditions that created the reading are already over.
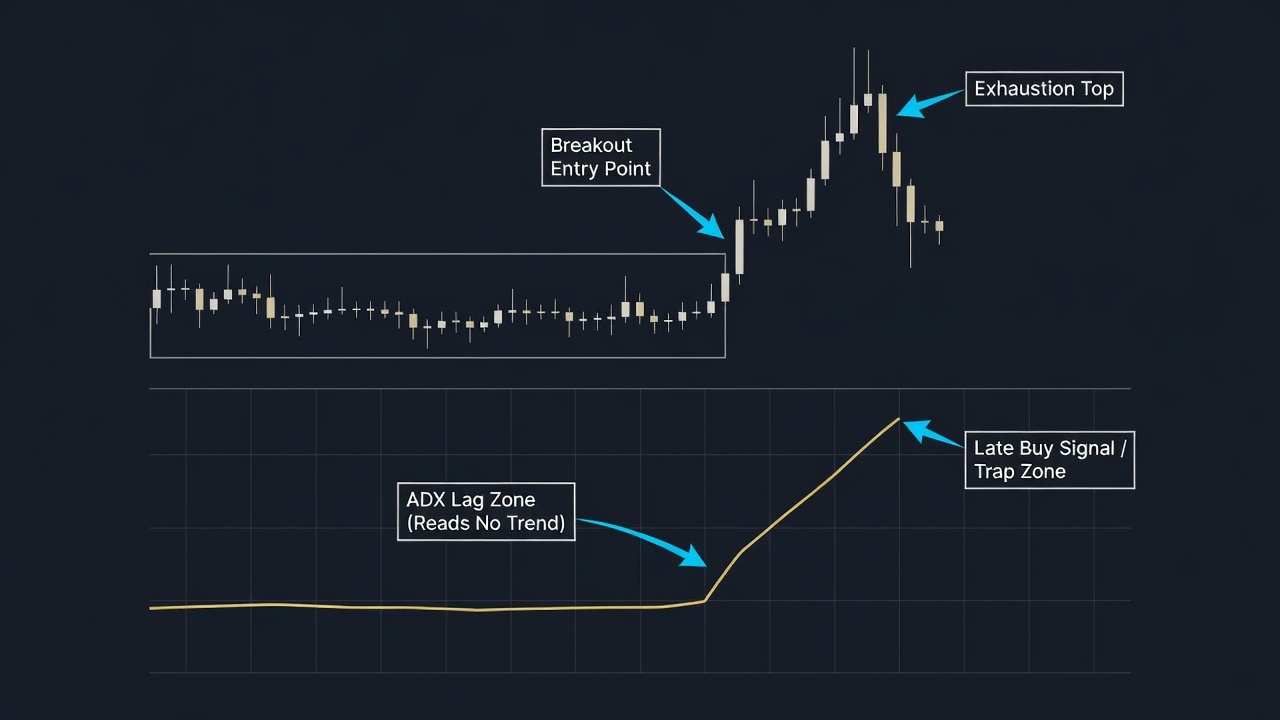
Picture a textbook setup: price coils tightly inside a 30-pip range for three days, volatility drops to zero, and the ADX sinks to 12. Suddenly, a massive breakout bar surges out of the range on high volume, kicking off a major trend. Because the ADX lookback is anchored to the previous two weeks of quiet bars, the indicator line barely budges to 15.
The conventional rule tells you to stay out because the ADX says there is “no trend.” So you watch price run for three straight sessions while you wait for the line to cross 25. By the time ADX finally prints 28 to give you the green light, price is overextended into major multi-month resistance and ready for a sharp pullback. You buy the exact top, get stopped out immediately, and wonder why your “trend filter” failed you.
The inverse is just as damaging. When a market starts whipping sideways in a violent, high-range consolidation, ADX often stays elevated above 30 for several days because of the recent directional momentum. You keep taking trend-continuation entries because the indicator says the trend is strong, only to get sliced up by mean-reverting swings.
What Actually Works
Stop outsourcing market regime detection to a lagging oscillator at the bottom of your screen. Chop and trend are structural behaviors that you can see clearly on pure price action.
The best way to identify whether a market is preparing for a sustained move is volatility compression. When candles shrink and daily ranges contract below their recent average, energy is building up. You do not need an indicator to tell you this; a simple Bollinger Band squeeze or visual range box shows you the coiling spring before the move happens.
Instead of waiting for an indicator threshold, define the structural boundaries of the range. Mark the clear highs and lows where liquidity sits. When price breaks and closes outside that boundary with expanding candle size, you have all the trend confirmation you need right at the breakout source.
If price is overlapping previous candle bodies and failing to break swing points, you are in chop. Treat it as a range market: fade the edges with tight risk or step aside completely. Watching price respect or reject key levels will protect your account far better than waiting for an indicator line to cross an arbitrary number.
When ADX Can Still Help
I do not hate the ADX, but I hate using it as a permission slip to take trades. Where the indicator actually brings value is spotting trend exhaustion late in an extended run.
If price has been trending for weeks and makes a distinct higher high, but ADX rolls over and prints a clear lower peak from above 40, directional strength is decaying. That divergence tells you the dominant buyers are losing their grip and a deep correction is brewing. Use it as an alert to trail your stops tighter, not as a timing tool for fresh entries.
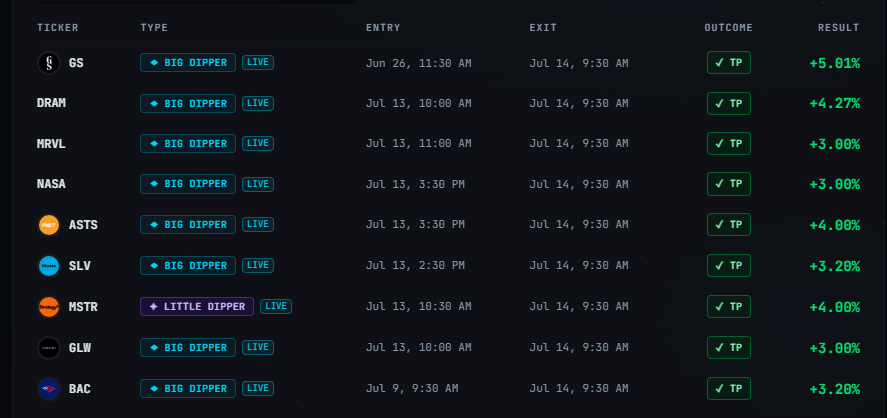
🎯 Want Setups Like These? The Big Dipper Does the Scanning For You.
Every morning the Big Dipper delivers curated DIP ZONE trade ideas — stocks already at high-probability entry levels, with targets pre-set. No guessing, no scanning. Just setups.

ADX Indicator FAQ
Q: Why does ADX stay low when a massive breakout candle occurs?
A: ADX uses a 14-period smoothing calculation that averages past price action, so several bars of tight consolidation will keep the line suppressed even during an explosive initial breakout.
Q: What is the best alternative to ADX for identifying choppy markets?
A: Monitor price structure directly by tracking horizontal range boundaries, candle body overlaps, and Bollinger Band width to spot volatility compression before expansion occurs.
Free For Traders
Know The EXACT Moment A Stock Hits Support Or Resistance
Real-time alerts fire the instant a stock approaches a critical level. Completely free.

From Find Better Trades
The Pullback Isn’t A Warning. It’s Your Entry.
Slingshot catches the exact moment a trend pause is ready to rip back in your favor — built for explosive pullback continuations.

📈 Want More? Join Our Free Trading Community
- Trading Strategy Guides Telegram — daily strategy tips and market insights
- Find Better Trades Telegram — free trade signals delivered to your phone
- Find Better Trades on YouTube — live trade breakdowns and tutorials


