
When RSI and a Key Level Line Up — That Is the Only Trade That Matters

📊 August 18, 2026
- RSI without horizontal price structure is pure noise; only trade momentum exhaustion when it slams directly into a proven key level.
- Blindly longing an oversold reading in a runaway trend will drain your balance while you fight institutional momentum.
- Map high-timeframe structural zones first, and use RSI strictly as a secondary timing trigger.
— Ben, Find Better Trades
Retail traders love treating the Relative Strength Index like an automated money printer. If the number drops below 30, they hit buy; if it crosses above 70, they slam the short button.
That single habit has blown up more trading accounts than almost any other bad habit in technical analysis. An indicator does not drive price, and momentum alone will never protect your capital.
Why Everyone Gets This Wrong
Most beginners completely misunderstand what the RSI measures. It calculates the velocity of price changes over a trailing window—it knows nothing about supply, demand, or where institutional limit orders are sitting.
During a strong trend, an asset can remain deeply oversold or overbought for days while price runs right through your stop. If you buy an asset simply because the RSI printed a 22, you are stepping directly in front of an active freight train.
Consider a typical breakdown scenario where an asset loses a major consolidation range and dumps rapidly into empty space. The 14-period RSI immediately plunges below 25, prompting thousands of retail traders to buy the dip because the indicator looks stretched.
Because price is hovering in a structural vacuum without any historical buyer interest, the selloff continues another eight percent down to the actual weekly support block. The early dip-buyers get completely liquidated before the real reversal even starts.
Naked indicators give you false confidence in random locations. When you trade an RSI reading in the middle of nowhere, you are essentially gambling on momentum math instead of trading actual market structure.
What Actually Works
The fix is dead simple: flip your workflow completely upside down. Location always comes first, momentum confirmation comes second.
Start your session on the higher timeframe and mark your key structural levels—prior swing highs flipped into support, weekly demand blocks, or clear multi-touch horizontal boundaries. These are the only zones where institutional liquidity resides.
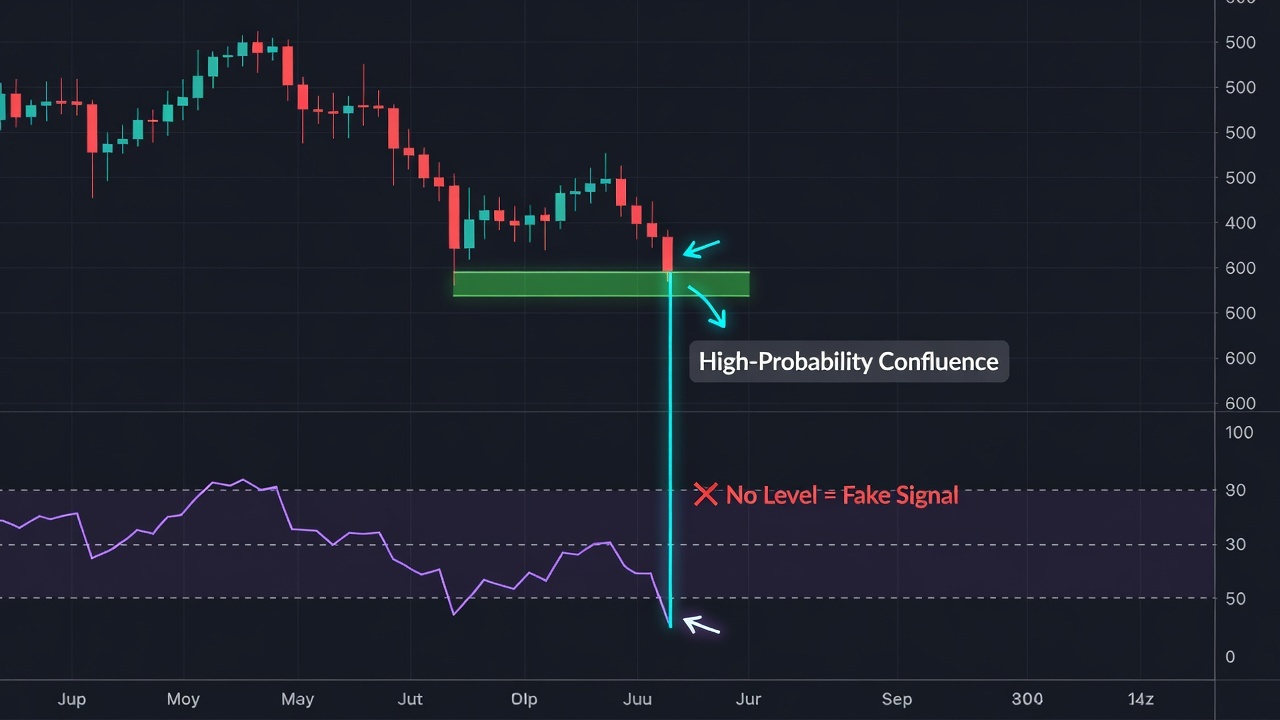
Leave the RSI alone until price physically tests one of those predetermined zones. If price aggressively sells off and hits a massive daily support level at the exact moment your RSI dips below 30, you suddenly have real asymmetric edge.
Now your risk is clearly defined by the chart structure, not an oscillating line. You place your stop just below the invalidation level of that horizontal zone, giving you a tight loss boundary and high reward potential.
When momentum exhaustion perfectly aligns with structural liquidity, you stop guessing bottoms and start entering high-conviction setups.
When RSI Can Still Help
RSI is far from useless, but it must remain a secondary filter rather than an entry engine. It shines brightest when keeping you disciplined—preventing you from chasing extended rallies into resistance or panic-selling into major support.
Use it to confirm that aggressive sellers have exhausted their immediate push just as price taps your structural buy zone.
🎯 Want Setups Like These? The Big Dipper Does the Scanning For You.
Every morning the Big Dipper delivers curated DIP ZONE trade ideas — stocks already at high-probability entry levels, with targets pre-set. No guessing, no scanning. Just setups.


RSI and Key Levels FAQ
Q: What timeframes work best for combining RSI with key levels?
A: Identify your major support and resistance levels on the daily or 4-hour chart, then monitor the 1-hour RSI for momentum exhaustion as price reaches those zones.
Q: Should I buy immediately when RSI touches 30 at a key level?
A: No, wait for the RSI line to curl back above 30 while price holds the level to ensure immediate selling velocity has actually cooled down before entering.
Free For Traders
One Clear Arrow. Every High-Probability Setup. Free.
The Fusion Indicator combines multiple signals into a single buy/sell arrow on TradingView so you never miss a move.

From Find Better Trades
When The Coil Is Ready To Explode, You’ll Know
Auto-maps ascending, descending, and symmetrical triangles with breakout alerts the moment price escapes the pattern.

📈 Want More? Join Our Free Trading Community
- Trading Strategy Guides Telegram — daily strategy tips and market insights
- Find Better Trades Telegram — free trade signals delivered to your phone
- Find Better Trades on YouTube — live trade breakdowns and tutorials


