Here’s Exactly What Magnizone Indicator Is and How It Works


📊 July 29, 2026
- Magnizone Indicator is a custom TradingView tool that automatically plots high-probability institutional support and resistance zones.
- It solves the problem of subjective chart clutter and manual guesswork when marking key price levels.
- Built specifically for active day traders and swing traders who rely on clean price action execution.
— Ben, Find Better Trades
I used to spend the first thirty minutes of every session drawing dozens of random lines that ended up cluttering my screens. Half the time, price sliced right through those arbitrary levels because I was marking retail noise instead of institutional interest. That exact frustration is why I built Magnizone Indicator.
What Is Magnizone Indicator?
Let me lay it out straight without any corporate fluff. Magnizone Indicator is a custom technical indicator designed for TradingView that automatically identifies and plots institutional support and resistance zones on your charts.
It is not a course, it is not a Discord signal group, and it is definitely not an automated black-box bot that trades for you. It is a clean visual script that runs directly on your desktop or mobile TradingView workspace.
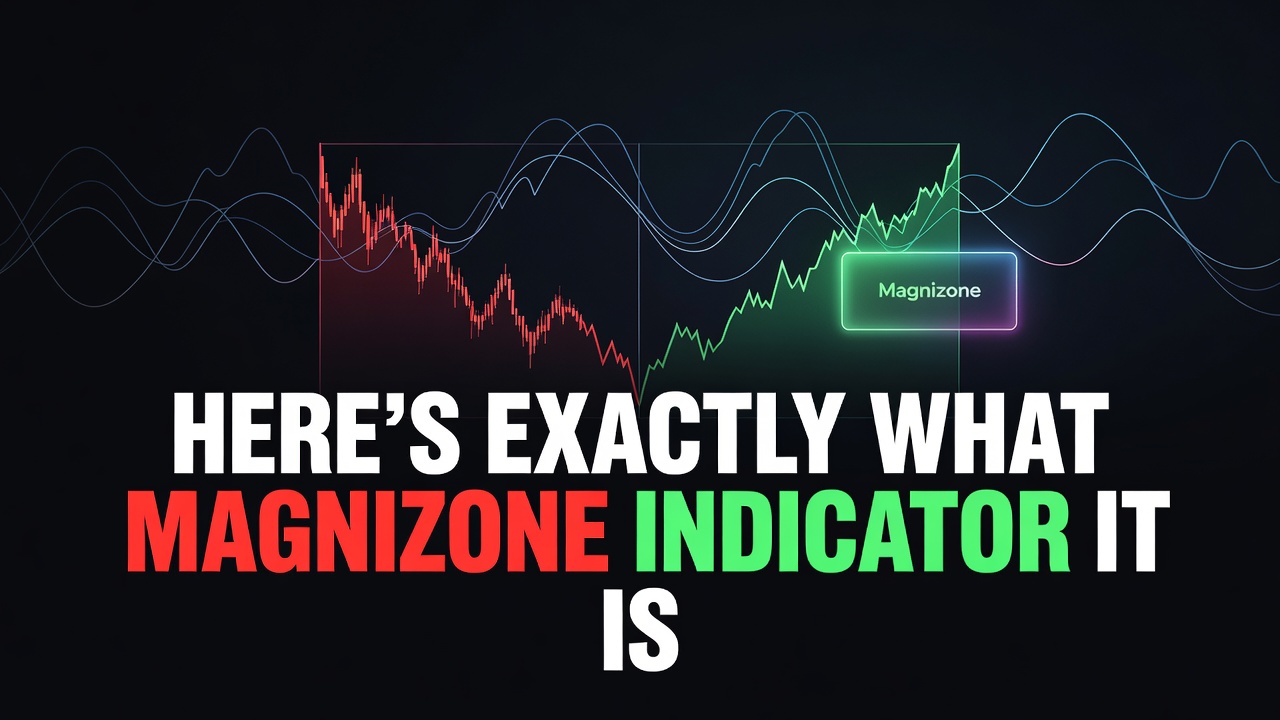
Instead of drawing static horizontal lines across every historical swing, Magnizone analyzes pure price action to highlight active areas where major order flow lives. You load it onto your chart, and it instantly draws precise, color-coded zones where price is most likely to react.
It also features built-in alert capabilities. That means you do not have to stare at your monitors for hours waiting for a retest; you set an alert through TradingView and let the indicator ping your phone when price enters a prime zone.
How Magnizone Indicator Works
The mechanics behind Magnizone rely entirely on structural market behavior rather than lagging indicators like moving averages or momentum oscillators. The algorithm scans raw price action to detect aggressive institutional buying or selling footprints that leave behind imbalances.

When the tool spots these structural footprints, it projects clear support or resistance blocks forward into real time. As price approaches these zones, you get an immediate visual map of where institutional capital stepped in previously.
Here is how a typical setup looks on your chart. Imagine you are watching an asset trending higher on the 15-minute timeframe. Instead of guessing where the pullback will stop, Magnizone automatically highlights a crisp demand zone right at the origin of the previous expansion.
When price pulls back into that highlighted box, you wait for your entry trigger or confirmation candle to go long. You define your risk right outside the painted zone and target the next overhead supply area that Magnizone has mapped out. It turns subjective chart analysis into an objective, repeatable process.
Who Should Use It
I built this tool specifically for active day traders and swing traders who rely on price action, supply and demand, or market structure. If you trade stocks, forex, crypto, or futures on TradingView, this fits right into your daily process.

If you are a total beginner who does not understand basic chart mechanics or risk management yet, you need to learn those fundamentals first. Magnizone makes your chart analysis faster and sharper, but it will not manage your risk for you.
However, if you already know how to trade and you are tired of spending hours plotting manual lines or missing key turns, this tool was built for you. It speeds up your chart prep dramatically so you can focus on crisp execution.
Frequently Asked Questions About Magnizone Indicator
Q: Do I need a paid TradingView plan to use Magnizone Indicator?

A: No, Magnizone works on both free and paid TradingView accounts without any issues.
Q: Does Magnizone Indicator repaint its zones after they form?
A: Absolutely not. Once a support or resistance zone is confirmed and plotted on your chart, it remains locked in place for full historical accuracy.
Free For Traders
Know The EXACT Moment A Stock Hits Support Or Resistance
Real-time alerts fire the instant a stock approaches a critical level. Completely free.

From Find Better Trades
Three Signals Align. Your Phone Buzzes. That’s It.
Trisignal only fires when all three confluence conditions line up — high-probability alerts sent straight to Telegram.

📈 Want More? Join Our Free Trading Community
- Trading Strategy Guides Telegram — daily strategy tips and market insights
- Find Better Trades Telegram — free trade signals delivered to your phone
- Find Better Trades on YouTube — live trade breakdowns and tutorials