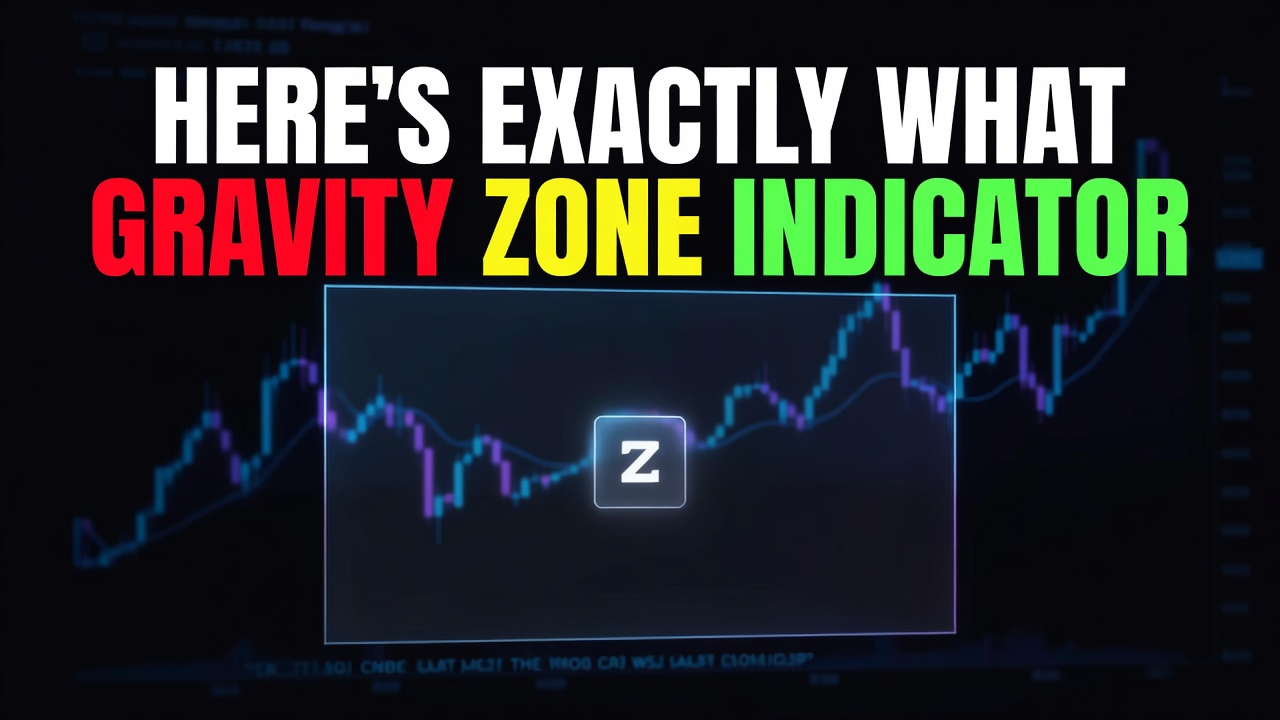
Here’s Exactly What Gravity Zone Indicator Is and How It Works


📊 July 26, 2026
- Gravity Zone Indicator is a custom TradingView indicator with automated alerts built to track institutional volume accumulation before major breakouts occur.
- It solves the problem of getting caught in fakeouts by revealing where heavy order flow is actually building under the surface.
- It is built for active momentum and breakout traders who want clear, objective volume signals heading into Monday’s open.
— Ben, Find Better Trades
For years, I watched retail traders jump into breakouts right at the top, only to get slammed by an immediate reversal. They were reading lagging price candles without seeing the massive institutional order flow building right under their noses.
I got sick of seeing honest traders get chopped up by smart money traps. That is why I built the Gravity Zone Indicator—to give you a front-row seat to institutional volume accumulation before the price actually moves.
If you are tired of guessing whether a move is real or fake, this tool was designed specifically to give you clarity.
What Is Gravity Zone Indicator?
When traders ask me point-blank what this tool is, I tell them straightforwardly: it is a high-precision TradingView indicator packed with real-time alerts. It is not an auto-trading bot, a signal group, or an overhyped course filled with endless theory.

You overlay this custom script directly onto your TradingView charts across any timeframe or asset class you trade. Whether you focus on mega-cap tech stocks, index futures, or forex pairs, the indicator actively scans order flow and volume distribution in the background.
Instead of relying on standard visual volume bars at the bottom of your screen that only show past transactions, it calculates real-time volume density relative to price levels. It highlights high-conviction zones where big market participants are quietly loading or unloading massive positions.
You interact with it visually on your screen through clean, customizable overlay zones and automated alerts sent to your phone or desktop. When you perform your chart analysis heading into Monday, you instantly see where heavy institutional capital is anchored.
How Gravity Zone Indicator Works
The core mechanics revolve around detecting hidden order flow anomalies that standard lagging indicators completely miss. Large institutional desks cannot enter full positions instantly without moving the market, so they split orders into heavy accumulation zones over time.

Gravity Zone tracks this accumulating pressure and plots distinct visual boundary zones directly on your chart. When price approaches one of these heavy volume centers, the indicator measures whether the zone is holding as support or preparing for an explosive expansion.
Once volume surges past critical thresholds, the script fires a real-time breakout or rejection alert straight to your device. You do not have to stare at order books or manually compute volume profiles all day long to catch high-probability setups.
For example, picture a stock consolidating in a tight range while standard volume looks completely flat. Gravity Zone highlights an aggressive shift in underlying volume accumulation right at the resistance boundary.
When markets open tomorrow, you are not guessing whether a move above that consolidation range is a trap or a legitimate breakout. You already know heavy institutional volume was loaded inside that zone, giving you the confidence to trade the breakout alongside real momentum.
Who Should Use It
This tool is engineered specifically for active momentum, swing, and day traders who want objective volume data on their charts. If you trade breakout setups or trend continuation moves and want to stop getting trapped by low-volume fakeouts, this tool fits your daily routine perfectly.

However, I will be straight with you about who this is not for. If you are a complete beginner who does not yet understand basic chart patterns, market structure, or basic risk management, an advanced volume tool will not magically make you profitable overnight.
You still need baseline charting skills to manage your positions, calculate your position size, and take profits cleanly. Gravity Zone provides the institutional edge and raw order flow clarity, but you are still the trader executing when Monday’s open arrives.
Frequently Asked Questions About Gravity Zone Indicator
Q: Does Gravity Zone Indicator work on all TradingView plans and timeframes?

A: Yes, it works seamlessly on free and paid TradingView accounts across intraday, daily, and weekly timeframes for stocks, futures, crypto, and forex.
Q: How do I receive alerts when a high-volume zone breaks out?
A: You can set up standard TradingView alerts linked directly to the indicator to trigger push notifications, emails, or desktop popups the moment volume criteria are met when markets open tomorrow.
Free For Traders
Know What To Trade BEFORE The Opening Bell
The Big Dipper Dashboard hands you curated high-probability setups every single morning — free.

From Find Better Trades
Consistent Income. Any Market Direction.
The Income Project’s low-risk debit spread system generates steady returns whether the market runs up, down, or sideways.

📈 Want More? Join Our Free Trading Community
- Trading Strategy Guides Telegram — daily strategy tips and market insights
- Find Better Trades Telegram — free trade signals delivered to your phone
- Find Better Trades on YouTube — live trade breakdowns and tutorials