How to Draw a Trend Line the Market Actually Respects

Most traders have done this: you draw a trend line, price slices through it, and you redraw it. Then it breaks again. The idea of a trend line is fine. The problem is usually which points you connect. Here’s the simple rule set I use, a real chart example, and the mistakes I see most.
What a trend line is (and isn’t)
In an uptrend, a trend line connects the swing lows. In a downtrend, it connects the swing highs. It’s a record of where buyers or sellers showed up before. It is a map, not a prediction. Price can respect a line for weeks and then ignore it completely.
The 3 rules
1. Use clear swing points. A swing low is a candle with higher lows on both sides. You need at least two, and a third touch is what makes a line worth watching.
2. Draw on the timeframe you trade, then check one higher. If you trade the daily chart, draw there, then look at the weekly. A daily line that runs straight into a weekly level matters more.
3. Wicks or bodies: pick one and stay consistent. Neither is “right.” Switching between them chart to chart is what creates lines that seem to fail.
Common mistakes
- Forcing touches. If you have to cut through five candle bodies to hit a third point, it isn’t a line.
- Mixing timeframes. A line from a 5-minute chart doesn’t carry onto the daily.
- Redrawing after every break. When a clean line breaks, that’s information. Note it instead of erasing it.
When two lines meet: the triangle
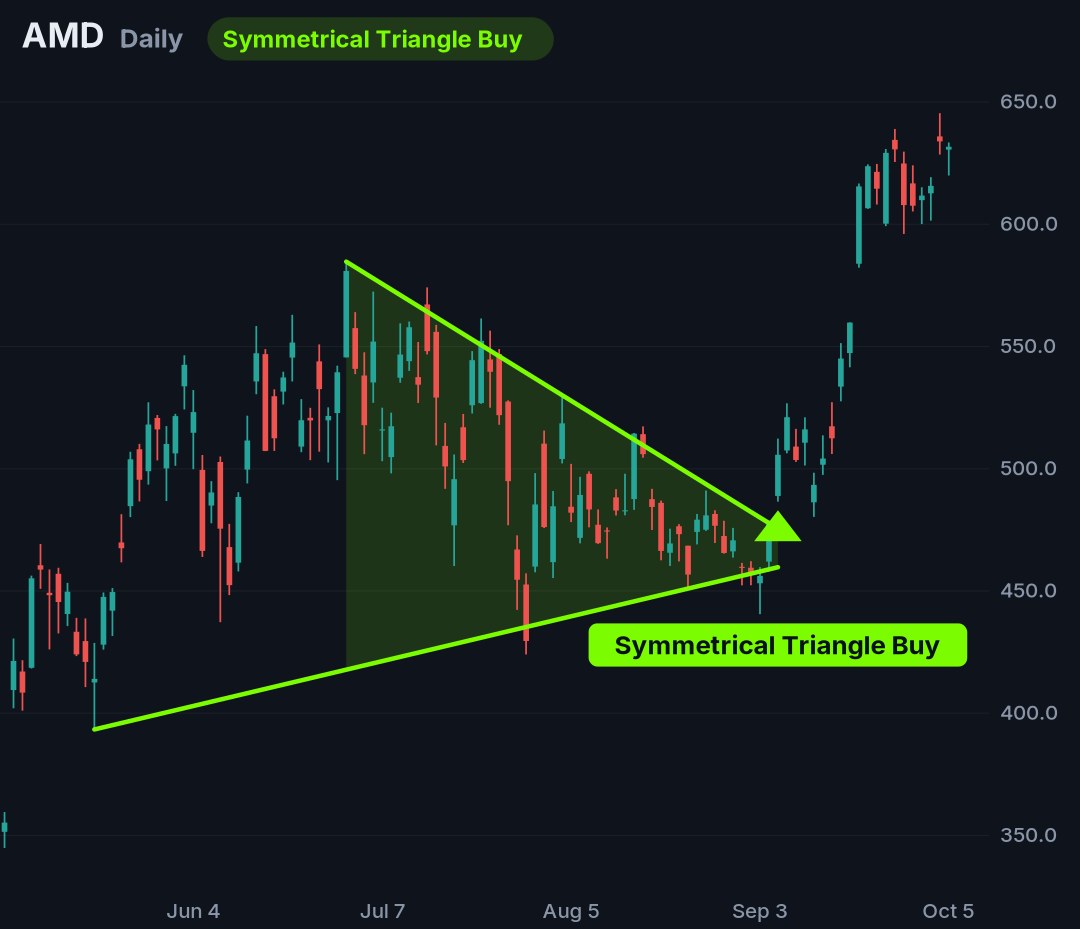
Draw a rising line under the lows and a falling line over the highs, and you’ll often see them converge. That’s a symmetrical triangle: price is coiling into a smaller range. Traders watching it look for two things: a candle close outside the lines (not just a wick) and whether volume picks up on that close.
Why triangles actually work
A triangle isn’t just a funky shape that happens to show up before some moves. There’s a real mechanism behind it.
When price gets squeezed into a smaller and smaller range, it changes where the orders sit. Buyers keep stepping in a little higher. Sellers keep stepping in a little lower. Lots of traders park their buy orders just above the top line and their sell orders and stops just below the bottom line. Inside the squeeze, there’s less and less room. Outside it, there can be a gap with fewer orders in the way: a kind of vacuum. When price finally closes outside the lines, it can move through that thin area quickly.
There’s a second piece too. For weeks a chart says “nothing is happening here.” Then one candle closes outside the triangle and the story changes to “a breakout is happening.” Traders who were watching jump in, scanners light up, and that new attention can feed on itself. It works a bit like a self-fulfilling prophecy.
None of that means every triangle breaks cleanly. (More on that below.) It does explain why so many traders watch these patterns, and why TriTrader+ is built around them.
An example TriTrader+ identified
Here’s a clean one, like this one our TriTrader+ system identified on the AMD daily chart this year.
From late spring through the summer, AMD kept making lower highs and higher lows. TriTrader+ anchored the falling line over the highs at the June 30 and August 4 swing highs, and the rising line under the lows at the May 19 and August 24 swing lows. Six touches on top, three underneath. By early September the range had tightened into a near-apex: weeks of “nothing is happening.”
Then on September 8, a candle closed above the upper line. That’s the bar where TriTrader+ labeled it a Symmetrical Triangle Buy and printed its signal arrow.
That’s the whole idea: the squeeze, the lines, the close outside. See how TriTrader+ draws it on your charts.
When it doesn’t work
Triangles don’t always resolve cleanly. Sometimes price closes outside the line and then comes straight back inside. That happens often, which is why many traders wait for a second confirming close or define in advance where the idea is wrong.
Doing it faster

$19 one-time · no subscription · 30-day refund. Requires a TradingView account (free plan works).
Drawing these by hand works. It’s also slow. Checking 20 charts each morning, finding the swing points, and drawing both lines took me most of an hour, and I still missed patterns when I wasn’t looking.
That’s why I built TriTrader+. It’s a TradingView indicator that finds swing points and draws six triangle and wedge patterns on your chart, then can send a TradingView alert when one is confirmed. It does the drawing. What you do with the chart is still your call.
- Connect clear swing points only, at least 2, ideally 3.
- Draw on your trading timeframe, check one higher.
- Choose wicks or bodies and stick with it.
- Count a break only on a candle close.
- Decide before the break where your idea is wrong.
Want the lines drawn for you? See TriTrader+ on your own TradingView charts.
See how TriTrader+ works$19 one-time · no subscription · 30-day refund. Requires a TradingView account (free plan works).
Educational content only, not investment advice. Trading involves risk, including loss of principal. Past chart patterns don’t guarantee future price behavior; results vary.
Find Better Trades · 6375 Penn Ave, Suite B #1260, Pittsburgh, PA 15206 · support@findbettertrades.com