
Bollinger Bands + Price Action: How I Spot Fakeouts Before They Happen

📊 August 16, 2026
- Bollinger Bands are useless for trade entries unless you read the candlestick physics occurring at the outer envelopes.
- Most traders get shredded because they treat outer bands as rigid support and resistance instead of dynamic volatility envelopes.
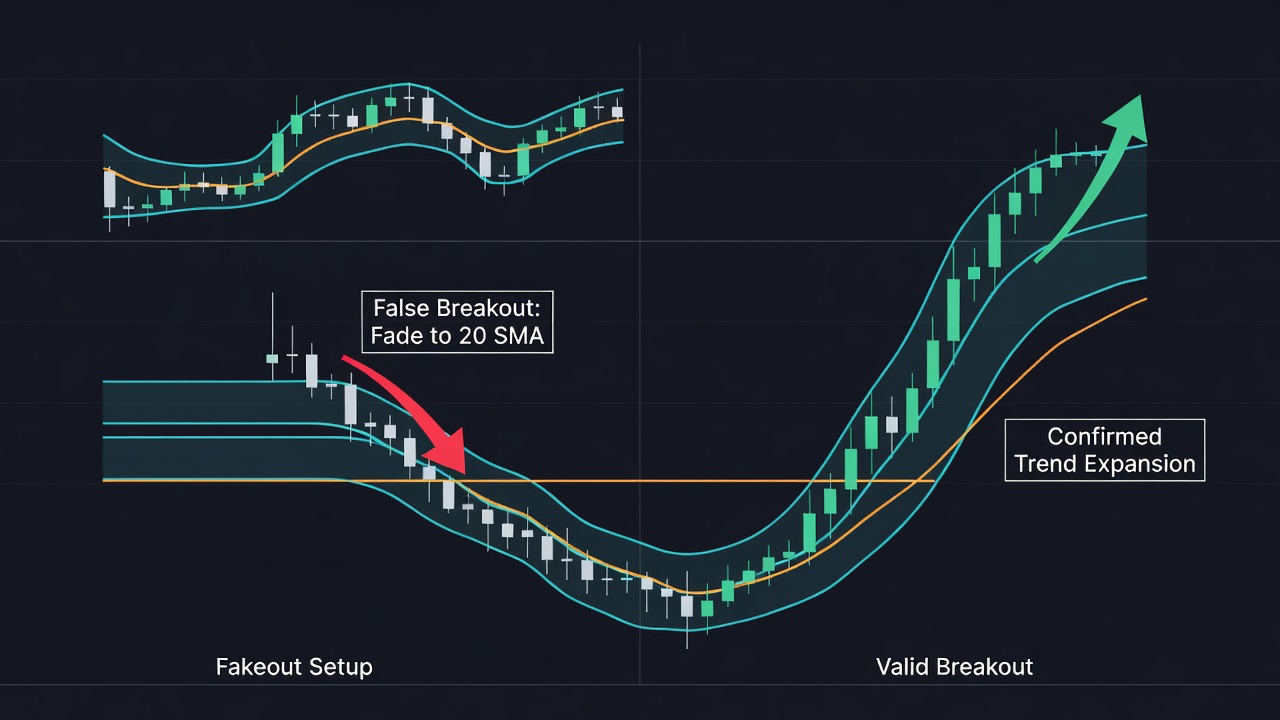
- Look for band expansion paired with full candle body closes outside the envelope to confirm real breaks, and fade wick-heavy rejections back to the middle band.
— Ben, Find Better Trades
Most retail traders treat Bollinger Bands like a pinball machine. They assume price must bounce between the upper and lower lines like clockwork, and then they wonder why their accounts bleed out when a real trend hits.
If you blind-short every upper band touch and buy every lower band tap, you are handing your capital straight to institutional order flow.
Why Everyone Gets This Wrong
The standard retail playbook teaches you that hitting an outer band means an asset is overbought or oversold. That simple assumption is the reason so many traders get wrecked during trend expansions.
Imagine a stock entering a legitimate markup phase where the bands are widening aggressively. Retail sees price touch the upper band and immediately opens a short position, expecting a quick mean-reversion move to the 20-period moving average. Instead, price hugs that upper envelope and continues grinding higher for days while the short position suffers massive drawdown.
The opposite trap happens during quiet, flat consolidation. A trader spots a single fast candle punching above a horizontal upper band and buys the breakout instantly. Because the opposing band is flat rather than expanding outward, there is zero volatility backing the move, and the next candle prints a massive rejection wick that drags price straight back to the center line.
Bands measure standard deviation, not absolute price ceilings. When you ignore whether the bands are expanding or contracting, you are trading blind.
What Actually Works
To spot a fakeout before it traps you, you need to combine the angle of both bands with how the candle actually closes relative to the envelope. When markets open tomorrow, start looking for asymmetry between the upper and lower bands before entering any breakout trade.
For a genuine breakout, you need three structural cues working together. First, the bands must transition from a tight squeeze into an aggressive expansion where the upper band curls up and the lower band mirrors it by flaring down. Second, the trigger candle must print a full, decisive body close outside the band—not just a temporary intra-candle wick.
If a candle pierces the upper band but leaves a tall upper shadow and closes back inside the channel while the lower band remains flat or slopes upward, that is your classic fakeout. In that scenario, the market lacks the institutional volume required to sustain volatility expansion, signaling an immediate mean-reversion setup back to the middle 20 SMA.
Heading into Monday, focus on the second candle following any outer band test. If the follow-through candle immediately fails to hold the outer band line as new support, the breakout is dead on arrival and you should look to trade the rejection.
When Bollinger Bands Can Still Help
Bollinger Bands are still phenomenal at one specific task: visualizing volatility cycles. Markets always rotate from low volatility compression into high volatility expansion, and nothing displays that contraction phase cleaner than a visible band squeeze.
Use the indicator strictly as a volatility filter to identify when a market is coiling, but let raw price action and candle closes dictate your actual trigger and risk placement.
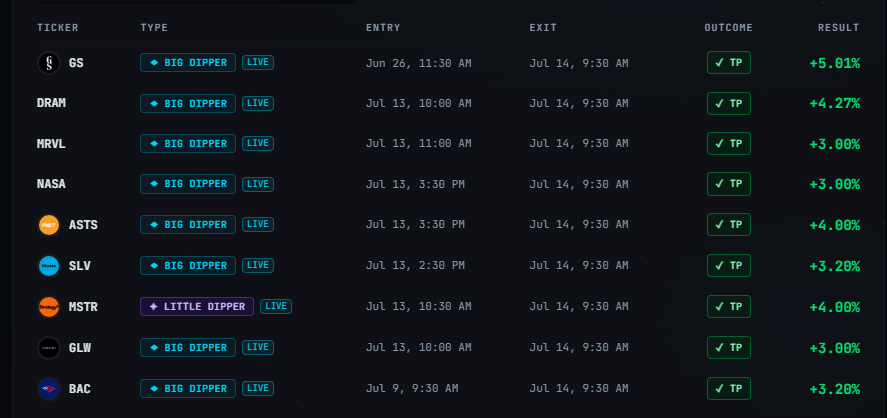
🎯 Want Setups Like These? The Big Dipper Does the Scanning For You.
Every morning the Big Dipper delivers curated DIP ZONE trade ideas — stocks already at high-probability entry levels, with targets pre-set. No guessing, no scanning. Just setups.

Bollinger Bands FAQ
Q: Why do Bollinger Bands fail during strong trends?
A: Standard deviation expands naturally alongside price momentum, allowing strong trending assets to continually walk the outer band without being overbought.
Q: What timeframe is best for spotting Bollinger Band fakeouts?
A: The 1-hour and 4-hour charts provide the cleanest reads because they filter out intraday noise while clearly displaying volatility expansion and true candle closes.
Free For Traders
One Clear Arrow. Every High-Probability Setup. Free.
The Fusion Indicator combines multiple signals into a single buy/sell arrow on TradingView so you never miss a move.

From Find Better Trades
Only Trade When Momentum Is HEAVILY In Your Favor
The Power Index oscillator measures trend conviction at a glance — it filters out weak, choppy action so you only take the strong moves.

📈 Want More? Join Our Free Trading Community
- Trading Strategy Guides Telegram — daily strategy tips and market insights
- Find Better Trades Telegram — free trade signals delivered to your phone
- Find Better Trades on YouTube — live trade breakdowns and tutorials


