Stop Trading Doji Candles as Reversals: You Are Being Hunted

📊 August 4, 2026
- Doji candles are not automatic trend reversal signals; treating them as mechanical turnarounds is a fast track to draining your account.
- The single biggest flaw with the standard approach is entering counter-trend positions blindly on a isolated candle without checking location or market structure.
- Instead of predicting reversals on candle closes, wait for price to sweep key liquidity and confirm a break of structure before risking capital.
— Ben, Find Better Trades
If you open counter-trend positions the second a Doji prints on your chart, you are actively funding institutional liquidity. Standard trading textbooks sold retail traders a dangerous myth that a neutral candle automatically guarantees an immediate price turnaround. I watch retail traders bleed capital every single week trying to catch falling knives just because a tiny cross-shaped candle appeared on their screen.
A Doji simply tells you that open and close prices landed in the exact same neighborhood over a specific timeframe. That is it. It reflects temporary equilibrium or a brief pause in momentum, not an automatic surrender by the dominant side.
Why Everyone Gets This Wrong
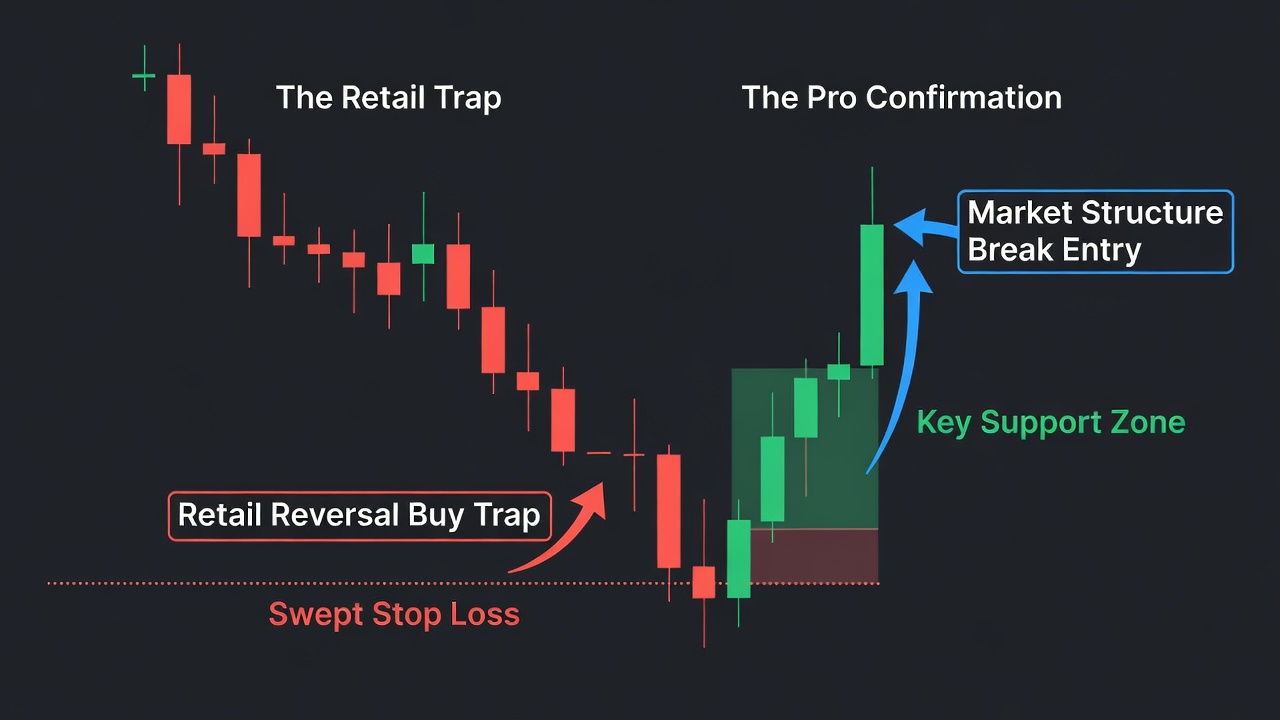
Retail technical analysis courseware treats candlesticks as isolated magic icons. The standard playbook tells you that after a prolonged aggressive downtrend, a Doji candle proves sellers are exhausted and buyers have taken control. Retail traders buy the instant that candle closes, placing their tight stop losses right below the Doji low.
That mechanical reaction is precisely what institutional algorithms exploit. Imagine an asset sliding relentlessly downward from $150 to $100 in a clean structural cascade. Suddenly, a Doji prints on the 15-minute timeframe at $101 because market participants briefly took profits before the next push lower.
Amateur traders see this neutral candle and flood the order book with aggressive buy orders, plastering stop losses right below $100. Smart money algorithms spot this obvious pool of sell-stop liquidity sitting just below the Doji tail. The market intentionally pushes price down to $99.50, sweeps every single retail stop loss, absorbs that forced selling, and only then decides where to move next.
When you trade a Doji without context, you are placing your money in the middle of a battle ground without knowing who holds the high ground. A single candle patterns contains zero information about underlying order flow or major key levels. Treating a 15-minute pause as a multi-day reversal signal is plain gamble, not systematic trading.
What Actually Works
If you want to survive in this market, you must treat candlestick shapes as secondary confirmation rather than primary entry triggers. Location is everything. A Doji floating in the middle of nowhere on your chart is complete noise and should be ignored entirely.
Start by identifying major higher-timeframe levels, such as weekly liquidity sweeps or major daily support and resistance zones. A Doji only becomes interesting when it forms directly inside a pre-identified higher-timeframe point of interest. If it does not touch a significant structural zone, close the chart and walk away.
Second, demand a lower-timeframe break of structure before placing a single dollar at risk. When price forms a Doji at key support, switch down a timeframe and wait for buyers to create a higher high and a clear change of character. If price cannot break the local swing high, the Doji was merely a continuation pause before another leg down.
Finally, measure the volume profile accompanying the candle wick. A valid accumulation Doji requires significant relative volume, proving that large passive limit orders absorbed aggressive selling. If volume is pathetic, buyers are absent, and price will collapse through the floor on the very next bar.
When Doji Candles Can Still Help
I am not telling you to strip Doji candles off your charts entirely, but you need to redefine their purpose. Doji candles excel as risk management alerts rather than aggressive entry signals. They tell you when to tighten risk, not when to jump headfirst into a fresh trade.
If you are holding a profitable short position down from a major breakdown level and price prints a heavy-volume Doji directly at a massive daily demand zone, that is your cue to take partial profits or trailing stop adjustments. It signals that passive buyers are stepping in to absorb supply, making aggressive continuation less likely in the immediate term.
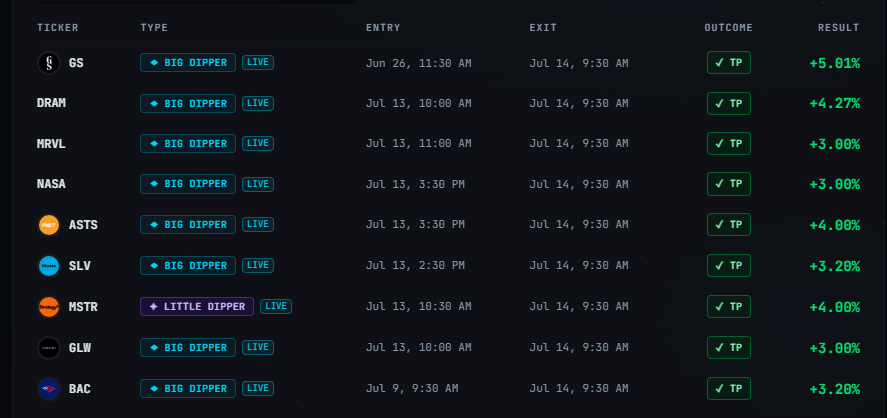
🎯 Want Setups Like These? The Big Dipper Does the Scanning For You.
Every morning the Big Dipper delivers curated DIP ZONE trade ideas — stocks already at high-probability entry levels, with targets pre-set. No guessing, no scanning. Just setups.

Doji Candle FAQ
Q: Is a Doji candle inherently bullish or bearish?
A: A Doji candle is completely neutral on its own because opening and closing prices are nearly identical. Its directional bias depends entirely on its location relative to major key levels and subsequent market structure breaks.
Q: Should I trade Doji candles on low timeframes like the 1-minute or 5-minute charts?
A: Absolutely not, because lower-timeframe Dojis are mostly noise created by bid-ask spread variations and temporary liquidity gaps. Focus on 1-hour, 4-hour, and daily charts where candle closes reflect true institutional positioning.
Free For Traders
Know The EXACT Moment A Stock Hits Support Or Resistance
Real-time alerts fire the instant a stock approaches a critical level. Completely free.

From Find Better Trades
The Pullback Isn’t A Warning. It’s Your Entry.
Slingshot catches the exact moment a trend pause is ready to rip back in your favor — built for explosive pullback continuations.

📈 Want More? Join Our Free Trading Community
- Trading Strategy Guides Telegram — daily strategy tips and market insights
- Find Better Trades Telegram — free trade signals delivered to your phone
- Find Better Trades on YouTube — live trade breakdowns and tutorials