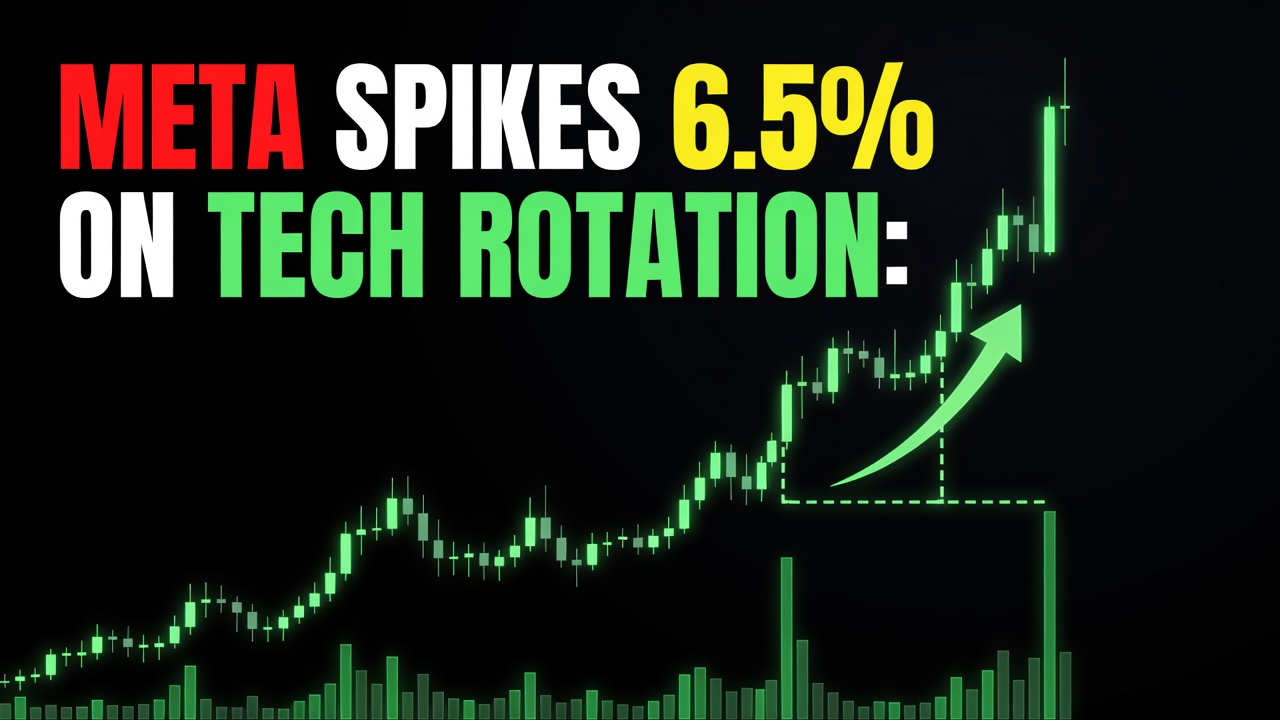
META Spikes 6.5% on Tech Rotation: August 3, 2026

🚨 BREAKING STOCK ALERT — August 3, 2026
- META just ripped 6.50% today, blasting from $556.71 up to $590.83.
- Traders are flooding in on heavy institutional tech rotation and ad revenue confidence.
- Do not chase the high blindly—wait for a clean retest of $590 before putting fresh capital to work.
— Ben, Find Better Trades
I just watched META tear through key levels like they weren’t even there. Moves like this on mega-cap tech don’t happen every day, and I am telling my traders to pay close attention right now.
What’s Driving META’s Move
When a trillion-dollar giant rips 6.50% in a single session, it isn’t retail traders messing around. Big institutional money is aggressively rotating back into high-margin ad tech and AI leaders today.
The market is rapidly pricing in margin expansion and relentless ad spend efficiency. Wall Street clearly got caught off-guard on positioning, and shorts are getting steamrolled as buyers lift every offer near $590.83.
My Read on This META Breakout
I am calling this move high conviction, but you have to trade it with actual discipline. Ripping straight from $556.71 to over $590 means implied volatility in the options market just spiked dramatically.
If you buy call options right now on elevated IV, you risk getting crushed by volatility crush if the price stalls. I am watching for a slight pullback to test support between $585 and $590 before entering a continuation trade.
If $590 holds into the close, the path toward $600 is wide open. I am definitely not fading this strength—the momentum belongs entirely to the bulls today.
META Stock Move FAQ
Q: Why is META stock up today on August 3, 2026?
A: META is surging 6.50% due to aggressive institutional rotation into mega-cap AI and digital ad sector leaders. Strong buying pressure quickly lifted the price from a previous close of $556.71 to near $590.83.
Q: Should I buy META stock at $590 right now?
A: I do not recommend chasing the absolute high of a massive single-day spike. Wait for short-term price action to establish $585 to $590 as firm support before entering long.
Free For Traders
This Free Indicator Finds Overbought & Oversold Levels For You
Add the Red & Green Zone indicator to TradingView at zero cost. It does the level-hunting automatically on any chart.

From Find Better Trades
Ride The Trend. Skip The Whipsaw.
Clear directional bias with built-in noise filters and trailing stop logic — from entry to exit.

📈 Want More? Join Our Free Trading Community
- Trading Strategy Guides Telegram — daily strategy tips and market insights
- Find Better Trades Telegram — free trade signals delivered to your phone
- Find Better Trades on YouTube — live trade breakdowns and tutorials