Stop Using RSI as a Buy or Sell Signal (You’re Doing It Wrong)


📊 September 3, 2026
- RSI was never designed to be an automated trigger, and treating 30 and 70 as execution signals is draining your account.
- The fatal flaw is that high RSI readings represent strong institutional accumulation, not an automatic exhaustion point waiting to collapse.
- Use RSI as a momentum regime filter by buying pullbacks into 40-50 support during uptrends rather than shorting overbought conditions.
— Ben, Find Better Trades
If your strategy consists of buying because RSI dipped below 30 or shorting because it poked above 70, you are handing your money directly to larger players. I spent my first two years in the markets trying to pick tops with this exact indicator, and it produced some of the fastest account drawdowns of my career.
The entire retail trading industry treats the Relative Strength Index like a magic oscillator that marks exact reversal points. It is not an execution trigger, and using it as one shows a fundamental misunderstanding of what momentum actually represents.
Why Everyone Gets This Wrong
Every basic charting tutorial repeats the same script: buy below 30 because the asset is cheap, and sell above 70 because the asset is expensive. That logic sounds neat on paper, but it completely ignores the mathematical formula driving the indicator.
RSI measures the ratio of recent average gains against recent average losses over your lookback window. When an asset prints aggressive green bars with heavy volume, the numerator skyrockets, pushing the oscillator past 70. That does not indicate weakness; it confirms that buyers are in complete control of the order book.
Imagine a stock breaking out of a multi-month base with massive volume. The RSI quickly pushes to 76 on the initial expansion. The retail trader sees an overbought reading and opens a short position, expecting an immediate mean-reversion move.
Instead of pulling back, the stock grinds upward for three consecutive weeks while RSI hovers between 70 and 85. The short seller gets repeatedly squeezed out on every minor dip before capitulating at the exact top. The reading was not flashing a sell signal; it was confirming high-velocity institutional buying.
The exact same trap occurs on the short side during heavy markdowns. When an asset drops into structural distribution, RSI routinely falls below 30 and stays pegged in the teens. Novice traders step in front of that moving train trying to buy the discount, only to watch price drop another twenty percent while RSI barely budges.
Oversold conditions during an aggressive downtrend do not signal value. They signal unrelenting distribution, forced liquidations, and an utter lack of bid depth. Buying an oversold reading without structural confirmation is pure gambling disguised as technical analysis.
What Actually Works
If you want RSI to make you money instead of blowing up your margins, you have to invert how you view the scale. Stop looking for tops at 70 and bottoms at 30, and start using the indicator to identify momentum regimes.
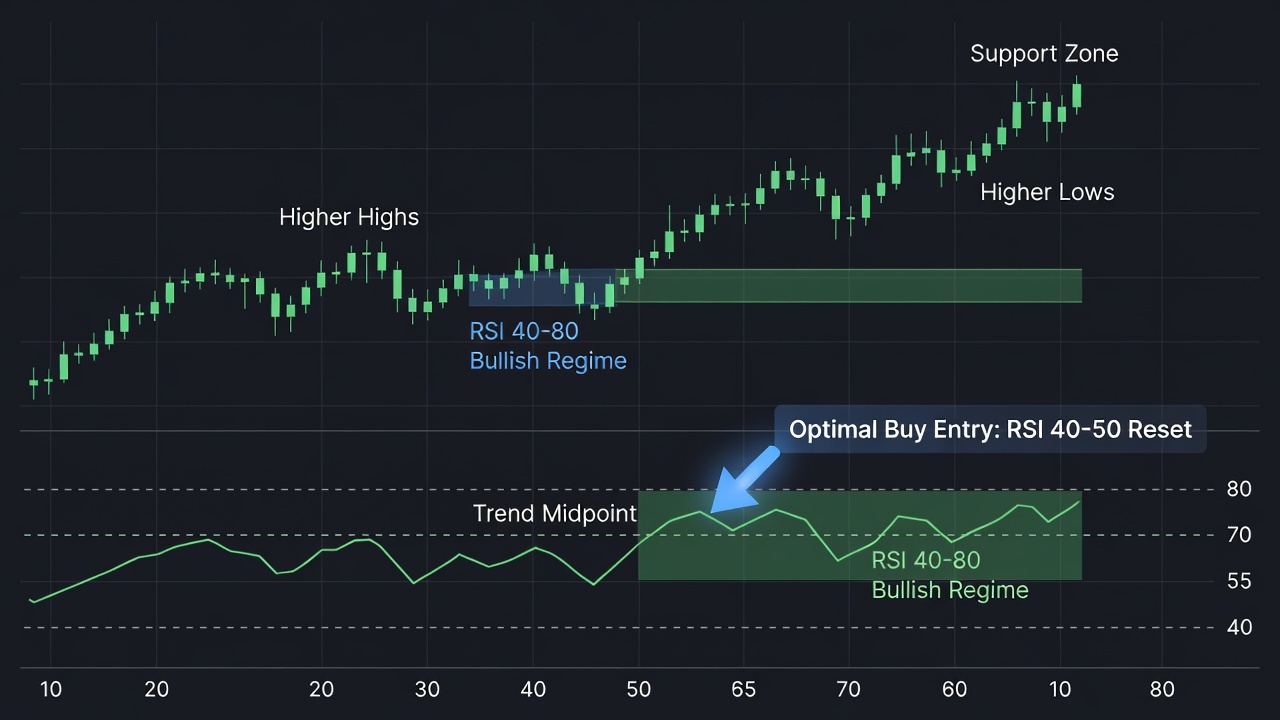
Decades ago, legendary technician Andrew Cardwell proved that RSI shifts its operating zones depending on market structure. In a verified bull trend, RSI rarely drops below 40; instead, it oscillates between 40 and 80. The 40 to 50 zone functions as momentum support where buyers consistently re-engage.
In a bear market, the entire range shifts downward to oscillate between 20 and 60. The 55 to 65 area becomes momentum resistance where sellers dump into relief rallies. If you understand this shift, you stop fighting the macro trend and start joining it.
Here is the exact playbook: identify an asset making clear higher highs and higher lows on the daily chart. Do not buy when it breaks out into overbought territory. Wait patiently for price to pull back into a prior resistance-turned-support zone while RSI resets into the 40 to 50 area.
When you see RSI tag 42 or 48 while price prints a bullish rejection candle at a key moving average, that is your entry. You are buying a pullback within an established trend at confirmed momentum support. You are aligned with institutional flow rather than trying to predict when they will run out of bullets.
For shorts, you simply invert the framework during confirmed downtrends. Let the asset plunge, let RSI tag oversold, and wait for the counter-trend bear bounce. When RSI crawls back toward the 55 to 60 zone while price hits a lower-high supply zone, you initiate your short.
When RSI Can Still Help
I am not telling you to delete RSI from your screens entirely. It remains one of the best tools on the desk when you use it for structural divergence at major daily or weekly support and resistance levels.
If price pushes to a higher high at a multi-month supply zone while RSI prints a noticeably lower high below 70, that divergence deserves your attention. It shows that while price managed to squeeze one more high, the internal velocity of the move is evaporating. Even then, the divergence is not your trigger—a break of the nearest swing low is.
🎯 Want Setups Like These? The Big Dipper Does the Scanning For You.
Every morning the Big Dipper delivers curated DIP ZONE trade ideas — stocks already at high-probability entry levels, with targets pre-set. No guessing, no scanning. Just setups.


RSI Trading FAQ
Q: Should I change the default 14-period setting on RSI to make it faster?
A: Shortening the period to 7 or 9 simply adds market noise and creates dozens of false overbought readings that will chop your capital to pieces. Stick to 14 periods so you are seeing the exact momentum baseline monitored by institutional algorithms.
Q: Does an RSI reading above 80 mean a reversal is guaranteed?
A: No indicator guarantees a reversal, and an RSI reading above 80 reflects extraordinary buying pressure that can persist across several weeks. Never enter a counter-trend trade simply because an oscillator reaches an extreme value without a confirmed structural market break.
Free For Traders
One Clear Arrow. Every High-Probability Setup. Free.
The Fusion Indicator combines multiple signals into a single buy/sell arrow on TradingView so you never miss a move.

From Find Better Trades
High-Win-Rate Patterns, Spotted In Real Time
Automated pattern recognition for reversals and continuations — no manual drawing, no missed setups.

📈 Want More? Join Our Free Trading Community
- Trading Strategy Guides Telegram — daily strategy tips and market insights
- Find Better Trades Telegram — free trade signals delivered to your phone
- Find Better Trades on YouTube — live trade breakdowns and tutorials