Why I am Buying the IBM Crush Using 2X Leverage

📊 July 14, 2026
- IBM is testing a massive multi-year support zone, making it a prime candidate for a high-conviction bounce play.
- The trigger is a clean daily reversal candle showing buying absorption within the current red support box.
- A daily close below the low of the support box around the 205 level invalidates the entire long thesis.
— Ben, Find Better Trades
IBM just got absolutely decimated over the last few trading sessions, and the panic is reaching a fever pitch. While the crowd is throwing in the towel, I am looking at this exact spot as a major tactical opportunity to go long. I am not looking to just sit in common shares; I am sizing into the 2X leveraged exchange-traded utility IBX to juice the returns on a high-probability bounce.
What the Chart Is Telling Me
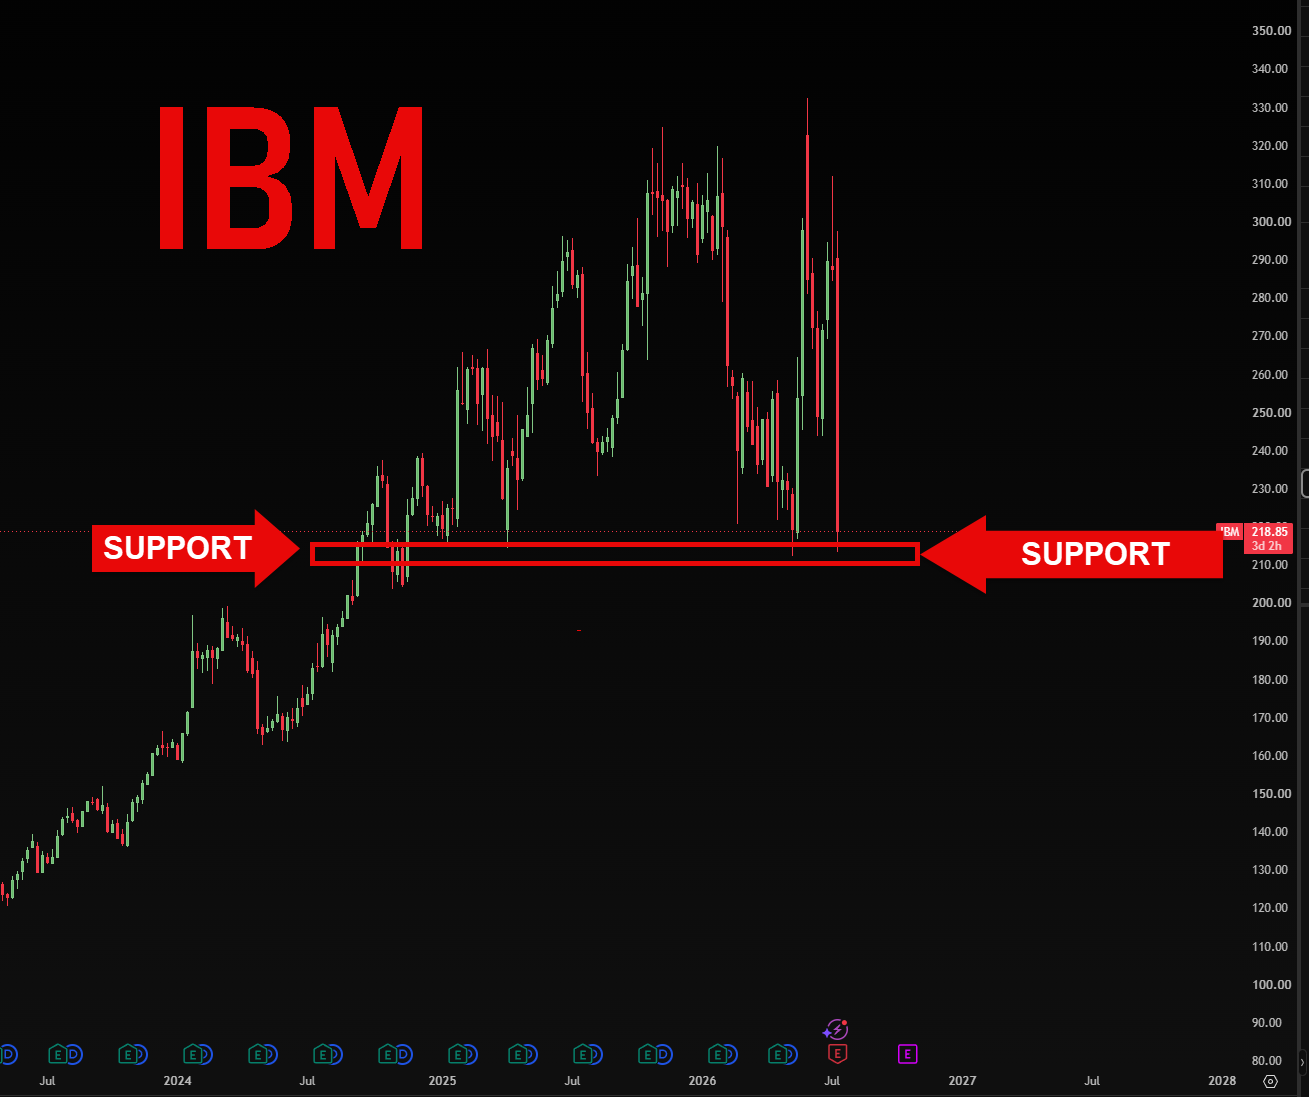
The daily chart of IBM shows a beautiful, clean structural footprint that is impossible to ignore. After a massive multi-year run that peaked near the 330 level, the price has undergone a brutal correction that wiped out months of gains in a matter of days. This brings us directly back to the most significant historical congestion zone on the entire chart.
If you look back to late 2024, this exact zone acted as major resistance, capping the rally before a massive breakout. We then saw it tested as support in early 2025, where buyers aggressively stepped in to defend it. Now, in mid-2026, we are retesting the exact same red support box shown on my chart, which lines up roughly between the 205 and 215 levels.
Markets have memory, and major institutional buyers do not forget where they previously accumulation block orders. The current plunge has driven the relative strength index into deep oversold territory directly as we hit this high-timeframe horizontal support. This is exactly where you want to step in and capture a mean-reversion move.
The Trade / What I am Watching
My plan here is straightforward and highly aggressive. I am establishing a position in IBX, which gives me 2X leveraged exposure to IBM, to play the expected relief rally off this horizontal floor. The leverage allows me to commit less capital overall while maintaining the same upside potential as a larger spot position.
I am watching for signs of seller exhaustion inside the red support zone on the daily timeframe. If we see a hammer candle, a bullish engulfing, or simply a couple of days of sideways consolidation followed by a strong green close, that confirms the floor is set. My primary target for this bounce is a retracement back toward the prior breakdown level near 245.
The beauty of this setup is the tight risk parameter. Because we are trading right against a major historical floor, our invalidation is crystal clear. A clean daily close below the bottom of the support box around 205 proves the bulls have completely lost control, and I will exit the trade immediately with a small, controlled loss.
Risk & What Could Go Wrong
The primary risk here is catching a falling knife during an aggressive momentum sell-off. Leveraged instruments like IBX suffer from volatility decay if the underlying asset chops sideways for a long period of time, so we need a relatively quick, sharp bounce to maximize the efficiency of the trade.
If a broader market correction drags down large-cap tech as a whole, this horizontal support may fail to hold. If the 205 level breaks on heavy volume, the next structural support does not show up until much lower down the chart, which is why strict risk management is mandatory on this play.
IBM Support Level Setup FAQ
Q: Why use the 2X leveraged IBX instead of trading IBM common stock?
A: Utilizing IBX allows me to maximize my capital efficiency on a high-conviction bounce play, capturing double the percentage move of the underlying stock while keeping a tight stop-loss to limit absolute dollar risk.
Q: What is the target exit price for this tactical long trade?
A: I am targeting a recovery back toward the 240 to 245 area, which represents the prior support-turned-resistance zone where sellers are likely to step back in.
🎯 Get High-Probability Trade Setups — Free
The Big Dipper Dashboard delivers curated trade ideas straight to your screen every morning. Know what to watch before the opening bell.

📈 Want More? Join Our Free Trading Community
- Trading Strategy Guides Telegram — daily strategy tips and market insights
- Find Better Trades Telegram — free trade signals delivered to your phone
- Find Better Trades on YouTube — live trade breakdowns and tutorials