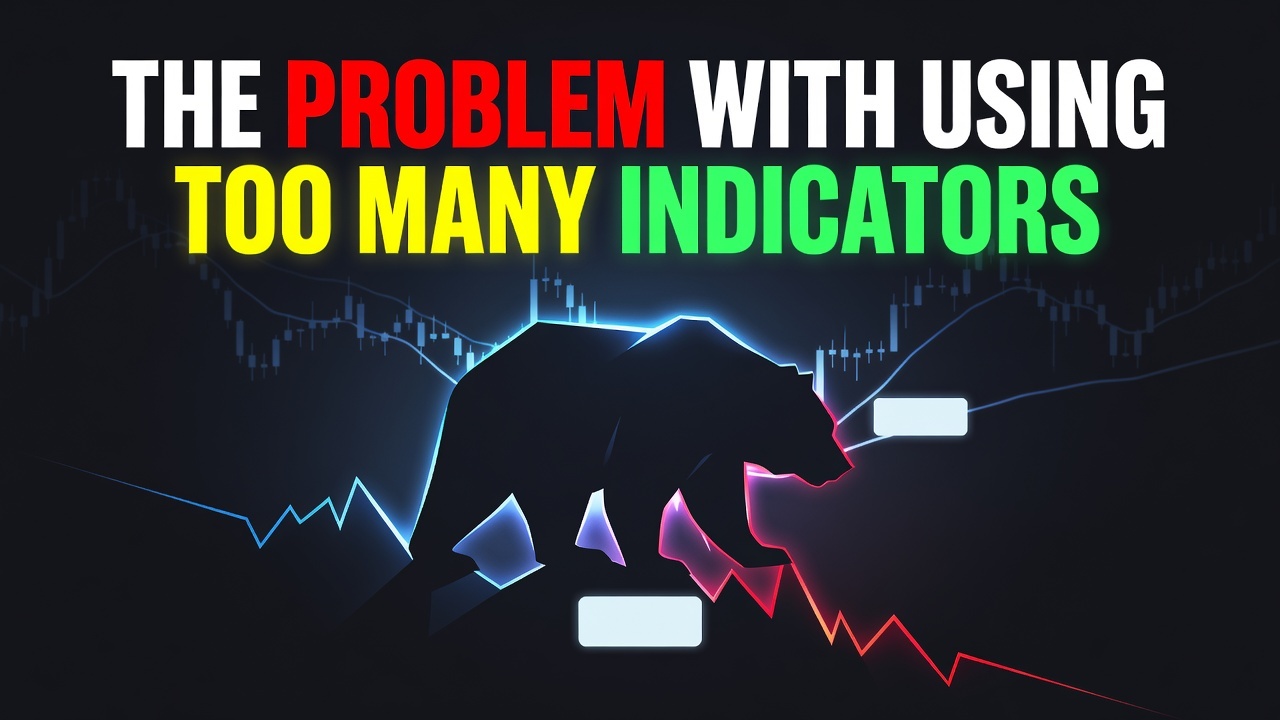
The Problem With Using Too Many Indicators at Once—You’re Paralyzed

📊 September 4, 2026
- Stacking indicators does not give you confirmation; it guarantees you will enter trades late and miss the real move.
- Nearly all retail oscillators run on the exact same price-and-volume data, meaning you are measuring the exact same lag three different ways.
- Strip your screen down to clean market structure, use a single baseline moving average, and trade real price reactions instead of math derivatives.
— Ben, Find Better Trades
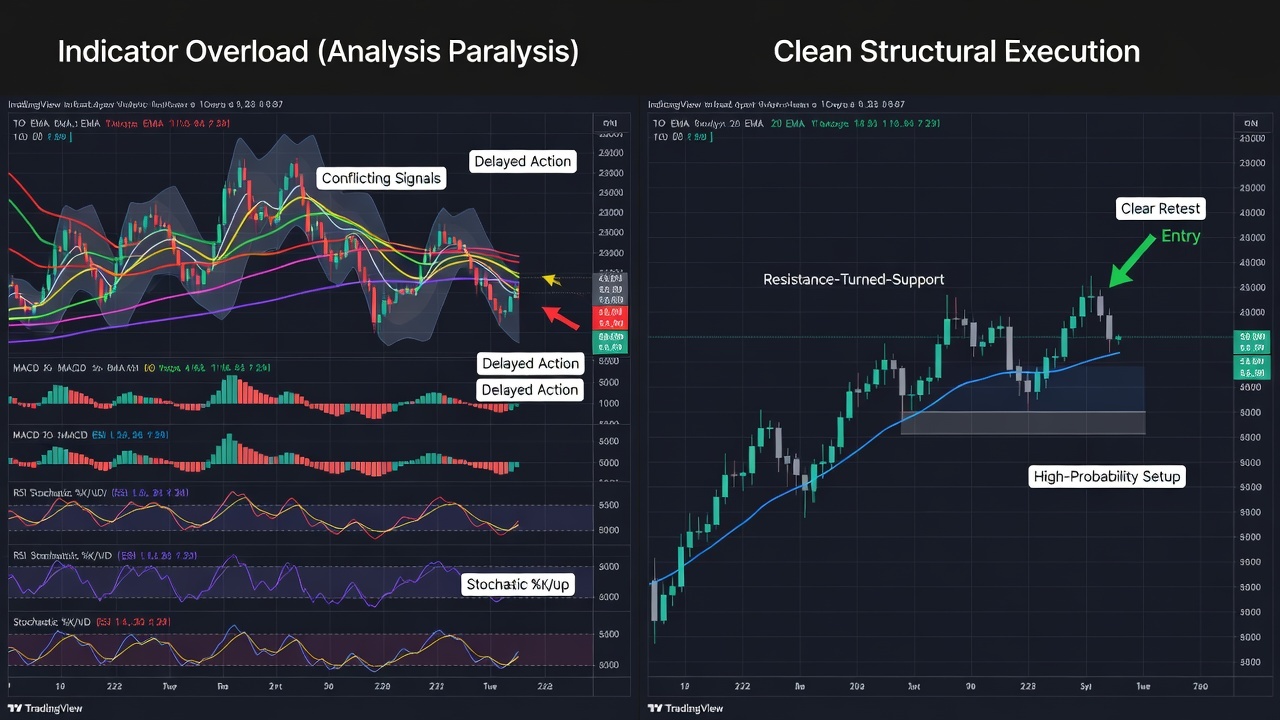
If your chart looks like an abstract neon painting with MACD, RSI, Bollinger Bands, and three moving averages squished into the bottom panel, you don’t have an edge. You have an anxiety blanket.
Retail traders bury themselves in indicators because they think more calculations equal more certainty. The market punishes that hesitation every single session.
Why Everyone Gets This Wrong
Conventional trading books preach that confluence requires confirmation from multiple independent tools. So you slap on a 200 EMA for the macro trend, an RSI to verify momentum, a MACD to confirm the trigger, and Stochastic to catch the pullback.
Here is the reality you need to face: every single one of those tools is a derivative of past closing prices. Stacking an RSI on top of a MACD is not getting a second opinion from another analyst; it is asking the same lagging math formula to repeat itself with slightly different smoothing parameters.
Think about what happens during a clean breakout setup. Price compresses tightly beneath a major resistance shelf, builds pressure, and explodes higher with aggressive buying volume on naked candles.
While the breakout prints clean entries off the structural retest, your RSI screams overbought, your Stochastic is pinned at the ceiling, and your MACD crossover is three candles too late. You freeze waiting for all three to align, and by the time they do, institutional traders are already dumping their shares straight into your market buy order.
What Actually Works
Wipe your screen clean of everything except raw candlesticks and a single reference guide—I use a simple 20-period exponential moving average purely to gauge dynamic value. Your eyes must train on market structure: swing highs, swing lows, and immediate liquidity pools, not squiggly lines crossing zero.
The only confluence with real predictive power is horizontal structure combined with current volume response. When price breaks through a key multi-day level and holds that boundary on a light-volume retest, that is genuine institutional absorption happening right now.
If you need confirmation to pull the trigger, read the candle closes around the key level. Look at whether buyers are actively rejecting lower prices, because supply and demand print on naked bars long before an indicator formula calculates its next tick.
When Multiple Indicators Can Still Help
Indicators have exactly one legitimate job: serving as an automated macro scanner before your trading day begins. A daily trend filter or an Average True Range reading is great for narrowing a watchlist of thousands of stocks down to five tickers that actually have enough movement to trade.
Once you sit down to execute on your active watch screen, secondary indicators belong in the trash. Use them to scan the market quickly, but execute your entries and exits purely off clean price structure.
🎯 Want Setups Like These? The Big Dipper Does the Scanning For You.
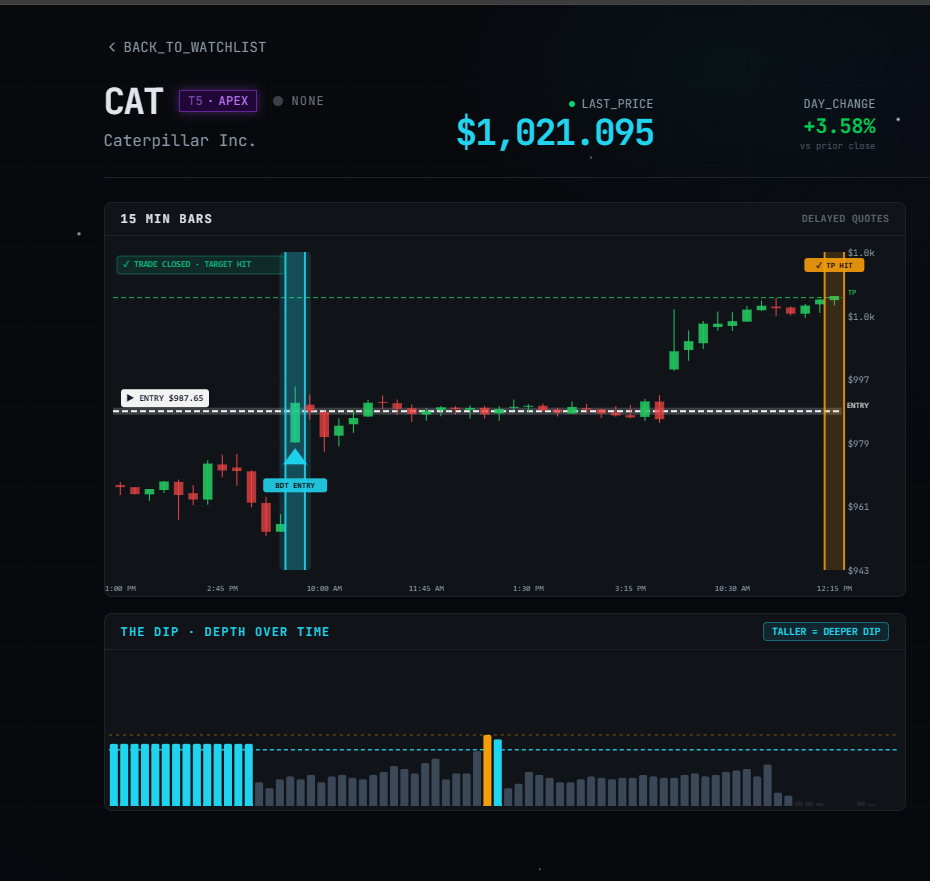
Every morning the Big Dipper delivers curated DIP ZONE trade ideas — stocks already at high-probability entry levels, with targets pre-set. No guessing, no scanning. Just setups.

Indicator Overload FAQ
Q: How many indicators should I actually have on my trading chart?
A: One or two at most. A single moving average for dynamic trend context and an ATR panel for calculating volatility-adjusted stop losses are all you need to execute cleanly.
Q: Why do oscillators like RSI and MACD give conflicting signals during strong trends?
A: Because oscillators are mathematically bound to mean-reverting ranges, meaning they register overbought conditions instantly during aggressive trends even while the underlying price action is screaming higher.
Free For Traders
One Clear Arrow. Every High-Probability Setup. Free.
The Fusion Indicator combines multiple signals into a single buy/sell arrow on TradingView so you never miss a move.

From Find Better Trades
Know Exactly Where The Big Money Steps In
Auto-plots institutional support & resistance zones from pure price action — no more guessing at levels.

📈 Want More? Join Our Free Trading Community
- Trading Strategy Guides Telegram — daily strategy tips and market insights
- Find Better Trades Telegram — free trade signals delivered to your phone
- Find Better Trades on YouTube — live trade breakdowns and tutorials