Why EMA Ribbons Lie to You in Ranging Markets


📊 September 2, 2026
- EMA ribbons give you false confirmation during consolidation while repeatedly shredding your capital through whipsaws.
- Stacking eight moving averages does not reduce lag; it merely prints eight variations of past prices across your screen.
- Ditch moving averages inside sideways ranges and trade clear horizontal boundaries with volatility compression tools instead.
— Ben, Find Better Trades
Every rookie trader loves slapping an eight-line EMA ribbon on their screen because colorful lines feel like institutional-grade intelligence. The harsh reality is that an EMA ribbon is the easiest tool for convincing yourself a trend exists when the market is completely dead. When price chops sideways, those glowing lines do not guide you—they bleed your trading account dry one crossover at a time.
Why Everyone Gets This Wrong
The standard technical analysis tutorial claims that when an EMA ribbon expands, explosive momentum has entered the market. Traders watch the fastest moving averages fan out above the slower ones and immediately execute market buy orders. They mistake a routine retest of a range boundary for the birth of a massive structural markup.
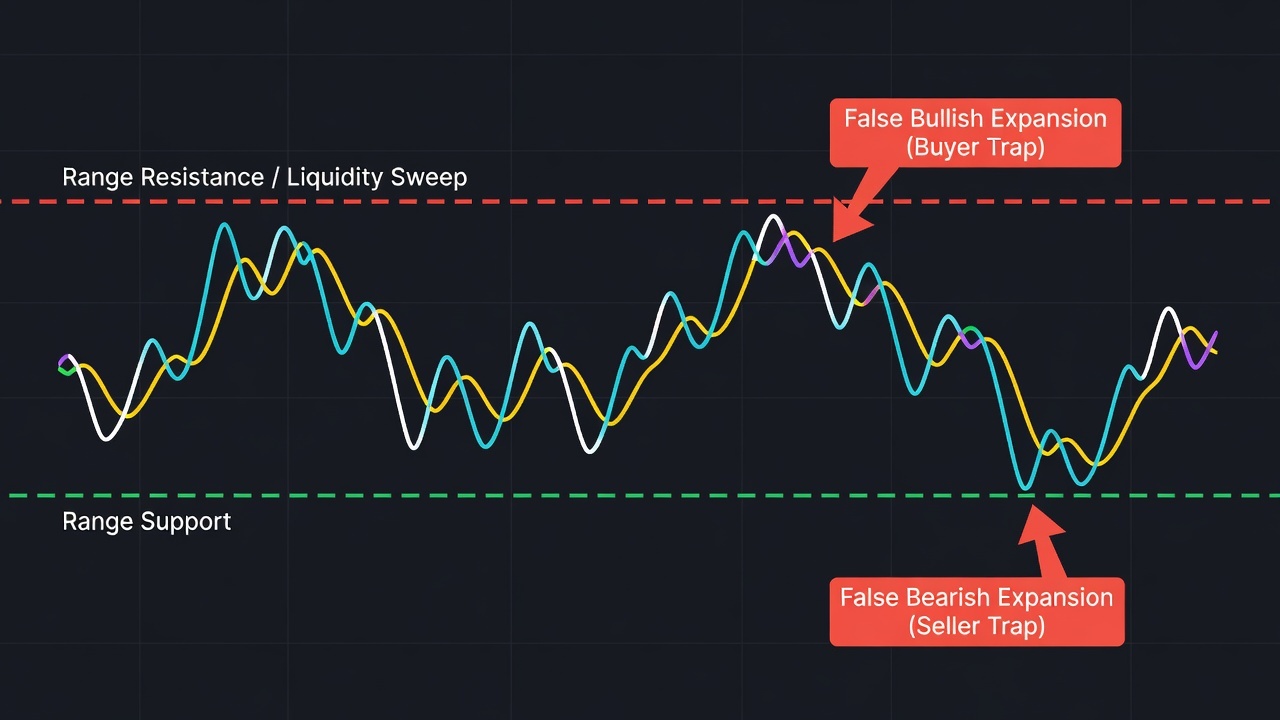
The mathematical flaw lies in how exponential weighting functions during a consolidation phase. Because an exponential moving average prioritizes recent price bars, two aggressive candles into the top of a range will force the ribbon to flare wide open. That visual flare looks like genuine trend strength, but it is nothing more than lagging math overreacting to short-term noise.
Picture an asset chopping strictly between support at ninety dollars and resistance at one hundred dollars over several weeks. When price makes a push up to resistance, the short EMAs rip higher and fan out across the chart in a picture-perfect bullish alignment. Amateurs buy the top because the ribbon looks powerful, right before smart money distributes into the liquidity and hammers price back down toward the range floor.
By the time the ribbon realizes the move failed, you are trapped in a brutal drawdown. You are forced to watch price slice back through the entire cluster before the indicator finally shows an exit signal. You buy the top of the chop, sell the bottom of the flush, and repeat the cycle until your capital is gone.
What Actually Works
The moment price action transitions into a trading range, you must turn off every moving average on your chart. In a sideways regime, dynamic curves are useless because price respects fixed horizontal liquidity pools, not moving calculations. You need to map clean support and resistance levels across the range extremes and identify where market participants are actually trapped.
Instead of relying on ribbon spreads to show momentum, switch to volatility compression indicators. Combine Bollinger Bands with Keltner Channels to measure whether the market is winding up for an expansion or simply idling between levels. When the bands pinch tightly inside the channels, you know volatility has cratered and directional indicators like ribbons will produce nothing but false signals.
Trade the edges of the box using horizontal failure swings rather than buying moving average crosses in the middle. Wait for price to poke through range resistance, exhaust itself, and close back inside the structure to enter short toward the opposite boundary. If you demand a trend, wait for an unambiguous breakout candle with heavy volume that closes entirely outside the range, followed by a clean horizontal retest.
When EMA Ribbons Can Still Help
EMA ribbons are not inherently broken—they are simply used in the wrong market regimes. In a verified, high-volume runaway trend, the ribbon works exceptionally well by providing a dynamic trail that keeps you from exiting winning runners too early. Pullbacks that find support along the twenty-one or thirty-four EMA during persistent trends offer clear, asymmetric trend-continuation entries.
The critical discipline is knowing when to strip the ribbon off your chart. If the ribbon lines begin braiding tightly together like a rope and flattening out horizontally, the trend is dead. The second that happens, your moving averages must go dark until structural price action proves a new trend has actually begun.
🎯 Want Setups Like These? The Big Dipper Does the Scanning For You.
Every morning the Big Dipper delivers curated DIP ZONE trade ideas — stocks already at high-probability entry levels, with targets pre-set. No guessing, no scanning. Just setups.


EMA Ribbon FAQ
Q: Why do EMA ribbons give so many false signals during market chop?
A: Moving averages calculate past prices, meaning an EMA ribbon lags behind current action and forces you to buy near range highs and sell near range lows.
Q: How do I know when to turn off my EMA ribbon?
A: Turn off the ribbon whenever price is bounded between clear horizontal highs and lows and the individual moving averages begin tangling into a flat braid.
Free For Traders
The Options Cheat Sheet Thousands Of Traders Swear By
Calls, puts, spreads — one free download tells you the right options strategy for every market condition.

From Find Better Trades
Learn The Spread System From The Ground Up
Build, manage, and exit low-risk debit spreads for consistent income — full video course.

📈 Want More? Join Our Free Trading Community
- Trading Strategy Guides Telegram — daily strategy tips and market insights
- Find Better Trades Telegram — free trade signals delivered to your phone
- Find Better Trades on YouTube — live trade breakdowns and tutorials