
Why Support and Resistance Is Still the Only Edge That Matters

📊 July 13, 2026
- Forget complex math: clean support and resistance is the only objective way to read institutional order flow.
- The single biggest flaw with the common approach is treating these key levels as exact price lines instead of broader supply and demand zones.
- Stop trading single-price lines and start executing trades when price action confirms a reaction inside high-timeframe zones.
— Ben, Find Better Trades
Every single day, I see retail traders cluttering their charts with five different lagging indicators, hoping some magical math formula will predict the future. They are looking for a secret weapon when the most powerful tool in trading has been staring them in the face the entire time. Horizontal support and resistance is the only structural reality on your chart, and everything else is just derivative noise.
If you cannot make money trading clean price action at key levels, a colorful oscillator at the bottom of your screen is not going to save you. It is time to strip away the junk and get back to what actually moves markets.
Why Everyone Gets This Wrong
The biggest reason retail traders fail with support and resistance is that they treat these levels like rigid, brick walls. They draw a thin black line at an exact price, say $150.00, and expect the market to bounce off it to the penny. When price sweeps past that line by thirty cents to grab liquidity before reversing, they get stopped out and complain that support and resistance is dead.
Markets do not operate on single-price points because institutional orders are filled in blocks across a range of prices. When you view a support level as a strict line, you are falling directly into the liquidity trap set by large market participants. They want you to place your stop losses right behind that obvious line so they can trigger them, fill their buy orders, and push the price back in the original direction.
Imagine a scenario where a stock rallies, pulls back to a previous resistance level, consolidates briefly, and then aggressively flushes downward through the level. The average trader immediately shorts the breakdown, thinking the support has failed. Two candles later, the price surges back above the level, leaving the breakout traders trapped in a massive squeeze because they reacted to a line rather than market structure.
What Actually Works
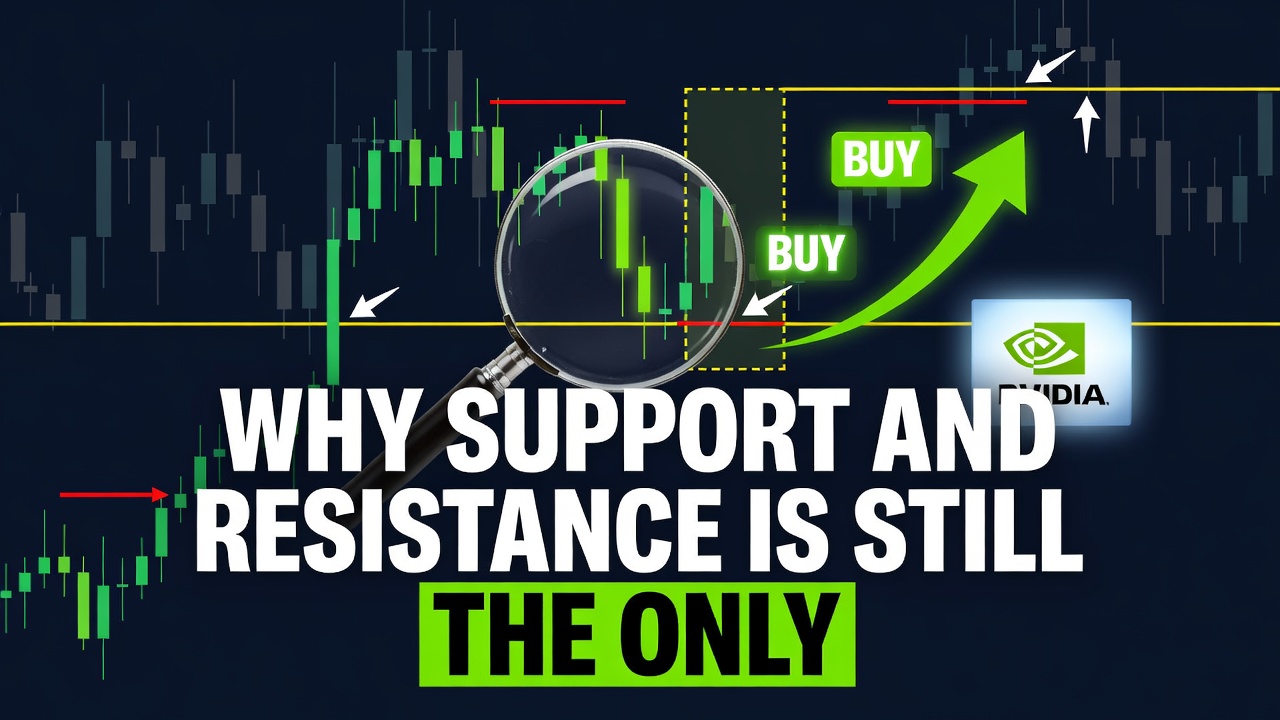
To win with support and resistance, you must stop drawing lines and start drawing zones. I want you to look at the previous swing highs and lows and define a zone of supply or demand using the candlestick bodies and wicks. This zone represents the actual area where buyers and sellers fought for control, and it gives your trade room to breathe.
Once you have your zone drawn, you do not just blindly place a limit order and hope for the best. You wait for price to enter the zone and look for a specific rejection signal, like a long-tailed pin bar or an engulfing candle on a lower timeframe. This confirms that the institutional players are actually stepping in to defend that zone before you risk a single dollar of your capital.
Your stop loss should never be placed just outside a thin line; it belongs on the other side of the entire price structure of the zone. This simple shift in execution immediately keeps you out of minor stop-runs and allows you to ride the real trend reversal with confidence.
When a Simple Level Can Still Fail
Of course, no level holds forever, and support and resistance will eventually break when a strong trend is underway. The key is recognizing when a zone is weakening, which usually happens on the third or fourth test of that level. Every time a level is tested, the resting orders sitting there get absorbed, making it much easier for the market to slice through on the next attempt.
If you see price repeatedly banging against a support zone with shallower and shallower bounces, do not buy it again. That is a clear sign that buyers are losing momentum and a massive breakdown is imminent.
Frequently Asked Questions About Support and Resistance
Q: How do I know which support and resistance levels are the most reliable?
A: The highest timeframe levels always dominate, so draw your zones on the daily or 4-hour charts first. A support zone on a daily chart will easily run over any minor resistance level you find on a 5-minute chart.
Q: Should I use wicks or bodies when drawing my support zones?
A: Use both to create your zone by drawing the boundary from the candle body close to the extreme edge of the wick. This captures the entire area of price rejection and gives you a realistic area to look for reversal setups.
🎯 Get High-Probability Trade Setups — Free
The Big Dipper Dashboard delivers curated trade ideas straight to your screen every morning. Know what to watch before the opening bell.

📈 Want More? Join Our Free Trading Community
- Trading Strategy Guides Telegram — daily strategy tips and market insights
- Find Better Trades Telegram — free trade signals delivered to your phone
- Find Better Trades on YouTube — live trade breakdowns and tutorials


