Why the BULL Breakout Set Up on Webull is the Trade of the Week

📊 July 10, 2026
- Webull is coiling directly beneath a massive multi-month resistance wall, setting up a high-probability explosive breakout.
- A clean, high-volume daily close above the 7.50 level confirms the entry for a run toward 9.00.
- A breakdown back below the ascending support trendline currently rising near 6.00 invalidates this bullish structure.
— Ben, Find Better Trades
I have been stalking this exact chart setup on Webull for weeks, waiting for the perfect moment to strike. The price has been relentlessly pounding against a massive resistance wall, and the sellers are finally starting to look exhausted.
If we can get the breakout I am looking for, this stock has the potential to make a massive, rapid move higher. I want you to understand exactly why this setup is so clean and how we are going to trade it.
What the Chart Is Telling Me
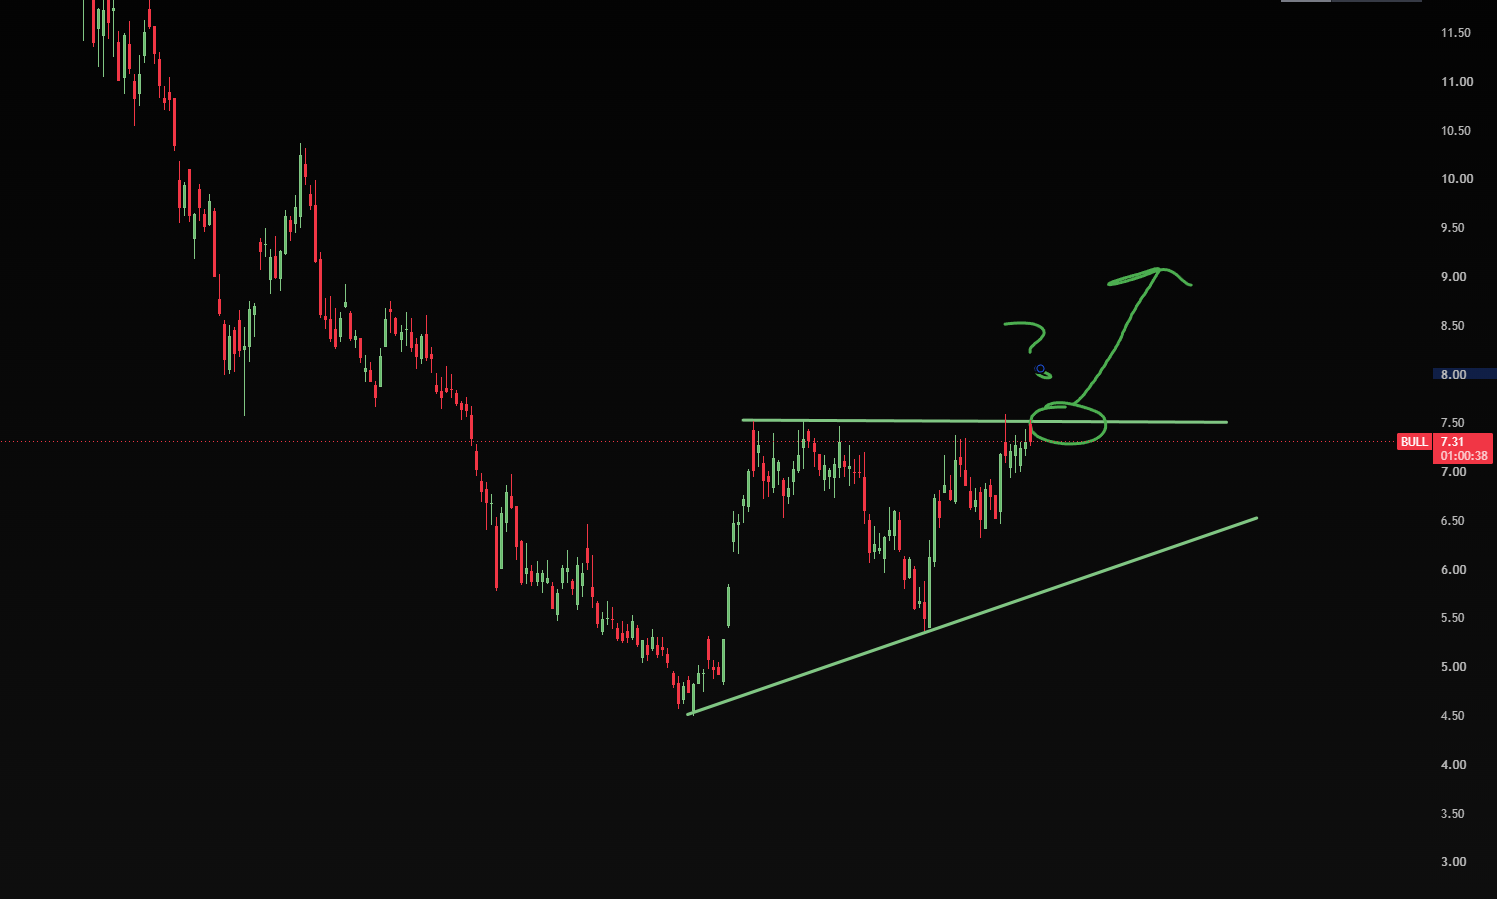
Looking at the daily chart, Webull has formed a beautiful ascending triangle pattern over the last several months. After bottoming out hard near the 4.50 level, the bulls have established a clear uptrend line, marked by increasingly higher lows.
Every time the price dips, buyers step in faster than they did before, driving the price right back up into the key resistance zone near 7.50. This horizontal ceiling at 7.50 has capped every single rally since the initial recovery attempt.
This constant retesting of the 7.50 level is the exact reason why I am so excited about this trade. In technical analysis, the more times a resistance level is tested, the weaker it becomes as sellers exhaust their supply.
Now, we are compressed tight right under the 7.50 zone, and the energy built up in this coil has to release soon. The upward-sloping trendline is forcing the price action into a corner, and a massive expansion in volatility is right around the corner.
The Trade / What I’m Watching
I am not buying this blindly while it sits under the resistance line because that is how you get chopped up in a range. My trigger for this trade is a strong, high-volume daily candle close above the 7.50 resistance level.
Once we secure that 7.50 breakout, my primary target is a fast move up to the 9.00 region, which aligns with historical price action on the left side of the chart. The empty space above 7.50 means we could see a very rapid short squeeze once the breakout is triggered.
To manage my risk, my stop loss will be placed just below the recent swing low within the consolidation pattern, near 6.80. If the price breaks above 7.50 and then immediately collapses back below 6.80, the breakout has failed and I want out immediately.
Risk & What Could Go Wrong
The primary risk to this thesis is a bull trap, where the price spikes above 7.50 intraday but fails to hold the level by the closing bell. Fakeouts at major resistance levels are common when retail traders rush in too early without waiting for daily confirmation.
Additionally, if the broader market experiences a sudden wave of selling, it will drag Webull down with it, regardless of how good this pattern looks. If we break below our ascending support trendline currently tracking near 6.00, the entire bullish thesis is dead and we must walk away.
Webull Stock Breakout FAQ
Q: What is the best way to enter this Webull setup to avoid a fakeout?
A: Wait for a daily candle to close completely above the 7.50 resistance line on above-average volume rather than buying an intraday spike.
Q: Where is the ultimate target for this ascending triangle breakout?
A: Once 7.50 clears, the pattern projects a measured move target up toward the 9.00 resistance zone where previous selling pressure originated.
🎯 Get High-Probability Trade Setups — Free
The Big Dipper Dashboard delivers curated trade ideas straight to your screen every morning. Know what to watch before the opening bell.

📈 Want More? Join Our Free Trading Community
- Trading Strategy Guides Telegram — daily strategy tips and market insights
- Find Better Trades Telegram — free trade signals delivered to your phone
- Find Better Trades on YouTube — live trade breakdowns and tutorials