Top 5 Best Trend Following Indicators on TradingView: My Picks for 2026

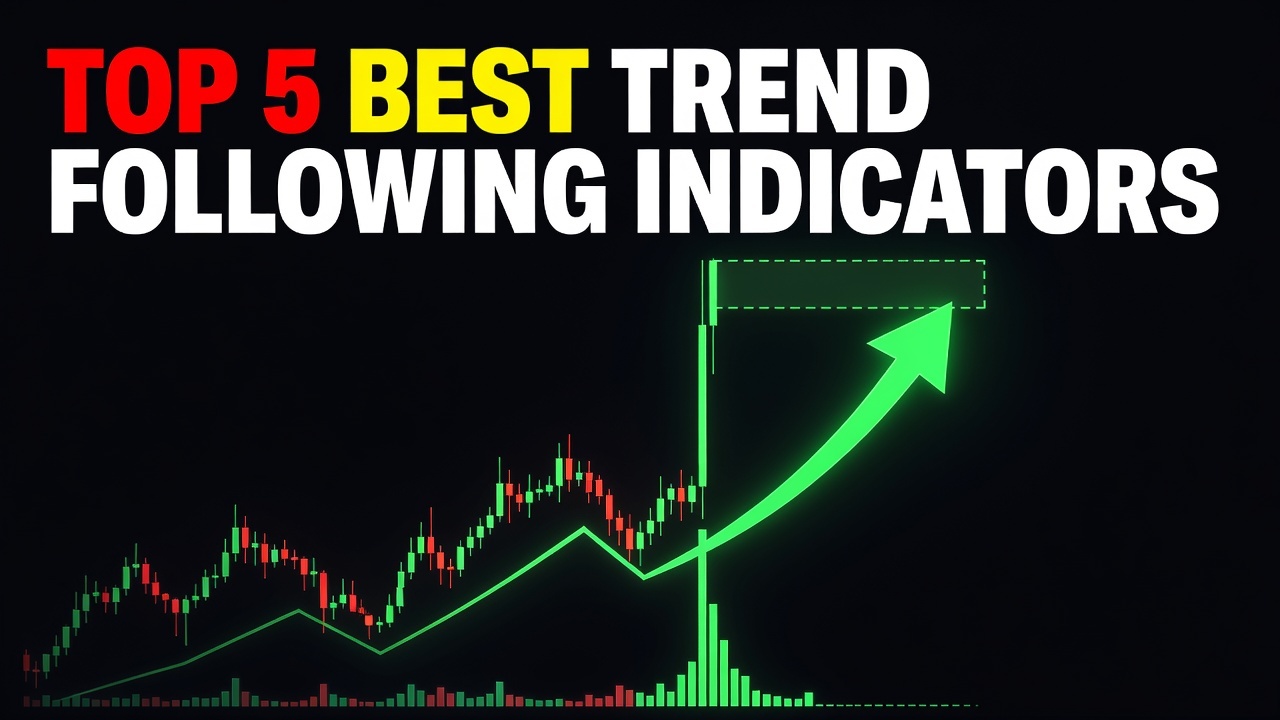
Alright, Ben here. We’re talking trend following indicators for September 2026. If you’re tired of getting chopped up by market noise and just want to ride the big moves, you’re in the right place. I’ve used a ton of these over the years, and I’m sharing what actually works for spotting and staying in major trends.
#5: Supertrend Indicator
The Supertrend indicator is pretty straightforward: it plots a line above or below the price, signaling an uptrend when below and a downtrend when above. It’s built on Average True Range (ATR), which means it adapts to market volatility, a nice touch. I’ve found it decent for quickly identifying general trend direction, especially on higher timeframes. It gives you clear visual signals for entry and exit points, which is helpful when you just need a quick read. However, relying solely on Supertrend can be tricky. It often gives false signals in choppy or sideways markets, leading to whipsaws if you’re not careful. It’s a reactive indicator, so it can lag a bit, meaning you might miss the absolute start of a trend. You’ll need other tools to confirm its signals and filter out the noise, otherwise, you’re just guessing.

Pros:
It’s easy to read and visually clear for identifying trend direction, adapting to volatility.
Cons:
It can generate numerous false signals in ranging markets and lags behind price action.
#4: Moving Average Ribbon (8 / 21 / 50 EMA)
The Moving Average Ribbon, specifically using a combination like the 8, 21, and 50 Exponential Moving Averages (EMAs), gives you a fantastic visual representation of trend strength and direction. When these EMAs spread out and align (e.g., 8 above 21, 21 above 50), it screams strong uptrend. I’ve used this setup for years to gauge momentum and potential reversals as the lines start to converge or cross. It’s a classic for a reason – simple, effective, and works across most markets. The downside? It’s still a lagging indicator. By the time the ribbon fully aligns, a significant portion of the trend might have already played out. Also, it’s purely visual; it won’t give you explicit alerts or automated signals. You’re responsible for constantly monitoring it and making your own judgment calls. For beginners, interpreting the nuances of a converging or diverging ribbon can take some practice.

Pros:
Offers a clear visual representation of trend strength, direction, and momentum changes.
Cons:
It lags price action significantly and requires constant manual interpretation without automated signals.
#3: ADX + Directional Movement Index
The ADX, combined with its Directional Movement Index (+DI and -DI), is a powerful tool for understanding both trend direction and strength. ADX itself doesn’t tell you if it’s an up or down trend, but it quantifies how strong the trend is. A rising ADX above 20-25 indicates a strengthening trend. The +DI and -DI lines then show you the direction. When +DI is above -DI, it’s an uptrend; when -DI is above +DI, it’s a downtrend. I’ve found this combo invaluable for confirming if a move has real conviction behind it, rather than just being noise. It helps filter out weak trends. However, ADX can be a bit complex for new traders to grasp, as you’re tracking three lines and their interplay. Like many indicators, it lags, and a strong ADX reading doesn’t necessarily mean the trend will continue indefinitely. It also doesn’t give specific entry/exit signals, requiring further analysis.

Pros:
Effectively quantifies trend strength and helps confirm the direction of price movement.
Cons:
It’s complex for beginners to interpret and does not provide explicit entry or exit signals.
#2: Parabolic SAR
The Parabolic SAR (Stop and Reverse) is excellent for trailing stops and identifying potential trend reversals. It plots dots above or below price bars, switching sides when the trend reverses. This makes it super effective for staying in a trend as long as possible while having a clear exit strategy. I’ve used it extensively for managing positions because it automatically adjusts, tightening the stop as the trend progresses. It’s a very visual and intuitive indicator for trend continuation and reversal points. It also helps lock in profits without micromanaging every candle. The main issue with Parabolic SAR is its sensitivity. In choppy or sideways markets, it can flip back and forth frequently, generating a lot of false signals and causing you to get stopped out prematurely. You really need a clear trend for it to shine. It works best when combined with other trend-confirming indicators to avoid getting whipsawed.

Pros:
Provides clear visual stop-loss placement and helps identify potential trend reversals effectively.
Cons:
It’s highly prone to whipsaws and false signals in consolidating or ranging markets.
#1: Trend Rider EDITOR’S PICK

Alright, let’s talk about the big one: Trend Rider. This isn’t just another indicator; it’s a full-on trend identification system designed to cut through the noise and give you clear, actionable signals. What makes it different? It combines multiple proprietary algorithms to confirm trend strength and direction, rather than relying on just one lagging input. It looks for confluence across different timeframes and market conditions, so you’re not just getting a simple moving average cross. I built this for serious traders who want to identify legitimate trends early and stay in them without getting shaken out by minor corrections.

Trend Rider delivers clear ‘Buy’ and ‘Sell’ signals right on your chart, no guesswork needed. It shows you when a trend is gaining momentum, when it’s consolidating, and crucially, when it’s losing steam or reversing. This isn’t some black box; it’s engineered to confirm trends with a high degree of probability, filtering out the false positives that plague most standard indicators. It’s perfect for swing traders, position traders, or even day traders on higher timeframes looking for bigger moves. You don’t need to be an expert in technical analysis to use it effectively, but if you are, you’ll appreciate the depth of its underlying logic.
One of the best features, and frankly, a must-have for any active trader, is its alert system. You can set up custom alerts on TradingView to notify you the moment a new trend signal appears. No need to stare at charts all day. This means you can react quickly and confidently, whether you’re at your desk or away. It’s fully compatible with TradingView, obviously, and designed to integrate seamlessly into your existing setup. If you’re serious about capturing major market trends and want an edge that consolidates the best of trend analysis into one robust package, Trend Rider is it. That’s why it’s my number one.
— Ben, Find Better Trades
There you have it – my top picks for trend following on TradingView. While the classics are good, they all have their quirks and limitations that can cost you money. You need tools that give you an edge, not just a lagging confirmation. For identifying and riding those big moves with confidence, nothing beats a comprehensive system.
If you’re ready to stop guessing and start catching trends with conviction, you really need to check out Trend Rider. It’s built to give you the clarity and confidence you need to trade smarter.
Frequently Asked Questions
What is the best trend following indicator for beginners?
For beginners, the Moving Average Ribbon (like the 8, 21, 50 EMA setup) is a great starting point because it’s visually intuitive for understanding trend direction and strength. However, for a more robust and easier-to-interpret solution that provides clear signals without complex analysis, a system like Trend Rider is ideal.

Is Trend Rider free?
No, Trend Rider is a premium product built for serious traders. It’s an advanced trend following system that offers unique algorithms and features not found in free indicators. Think of it as an investment in a more consistent and profitable trading strategy.
How do volume breakout indicators work?
Volume breakout indicators typically measure a sudden surge in trading volume when price breaks above or below a key level. This increased volume often confirms the validity of the price breakout, suggesting strong conviction behind the move. It helps traders distinguish between genuine breakouts and false ones that lack follow-through.
Are these trend following indicators compatible with TradingView?
Yes, every indicator mentioned in this list, including the Supertrend, Moving Average Ribbon, ADX, Parabolic SAR, and especially Trend Rider, are fully compatible with TradingView. You can easily add them to your charts and customize their settings within the TradingView platform for your analysis.
Free For Traders
The Options Cheat Sheet Thousands Of Traders Swear By
Calls, puts, spreads — one free download tells you the right options strategy for every market condition.

From Find Better Trades
Three Candles Tell You When The Move Accelerates
The 3-candlestick reversal pattern indicator that catches the exact moment momentum flips.

📈 Want More? Join Our Free Trading Community
- Trading Strategy Guides Telegram — daily strategy tips and market insights
- Find Better Trades Telegram — free trade signals delivered to your phone
- Find Better Trades on YouTube — live trade breakdowns and tutorials